Understanding Web Agent Results

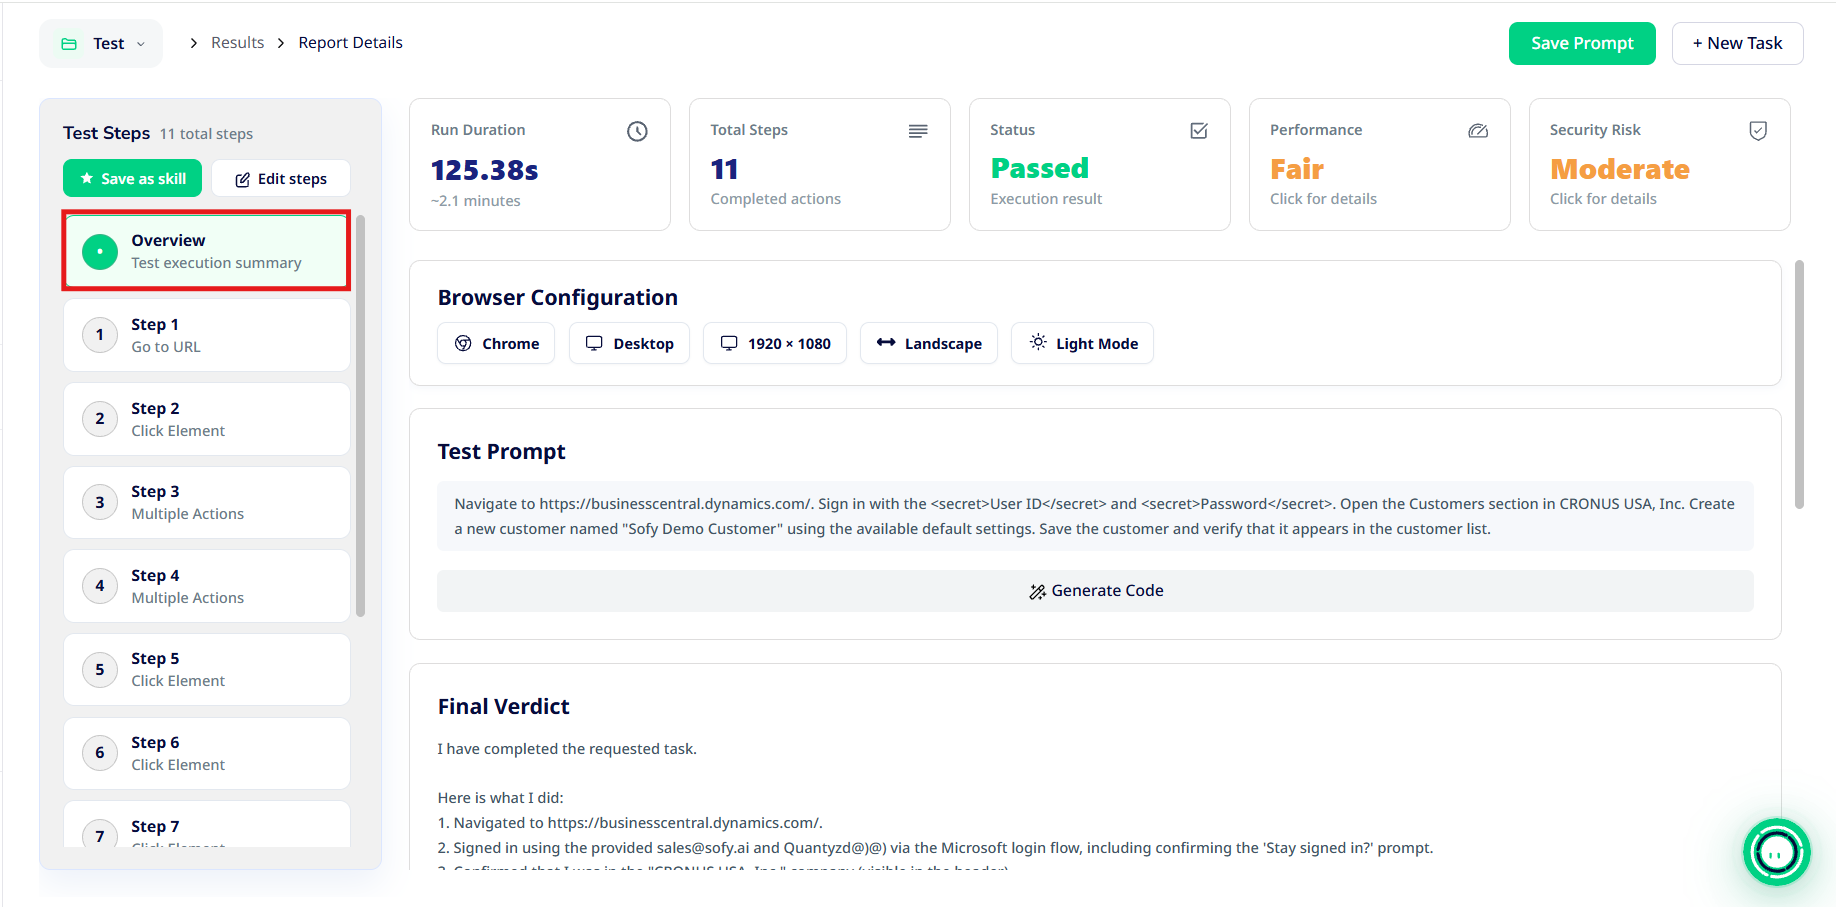
After a test execution is completed, Sofy Web Agent generates a detailed report showing the test outcome, execution steps, performance metrics, and potential security risks. Users can access reports from previous test executions at any time through the Results section.
The report helps users understand what happened during execution, identify performance bottlenecks, and review potential security issues.
1. Understanding Reports
Execution Summary
At the top of the report, you will find five key indicators:
- Run Duration - Total time taken to execute the test.
- Total Steps - Number of steps completed during execution.
- Status - Indicates whether the test passed or failed.
- Performance - Overall performance assessment based on network and response-time analysis.
- Security Risk - Overall security risk level based on potential vulnerabilities identified during execution.
Click Performance or Security Risk to view the corresponding detailed analysis.
Browser Configuration - This section displays the environment used during test execution, including:
- Browser - Browser used to run the test, such as Chrome.
- Device - Device type, such as Desktop.
- Screen Resolution - Browser viewport resolution, such as 1920 × 1080.
- Orientation - Landscape or Portrait.
- Display Mode - Light or Dark mode.
Test Prompt - The Test Prompt section displays the original instructions provided by the user to Web Agent.
Generate Code - Users can generate and download Selenium code based on the executed test using the Generate Code option.
Final Verdict - The Final Verdict provides a summary of the test execution. It describes the actions performed by Web Agent, the outcomes of the workflow, and whether the requested task was completed.
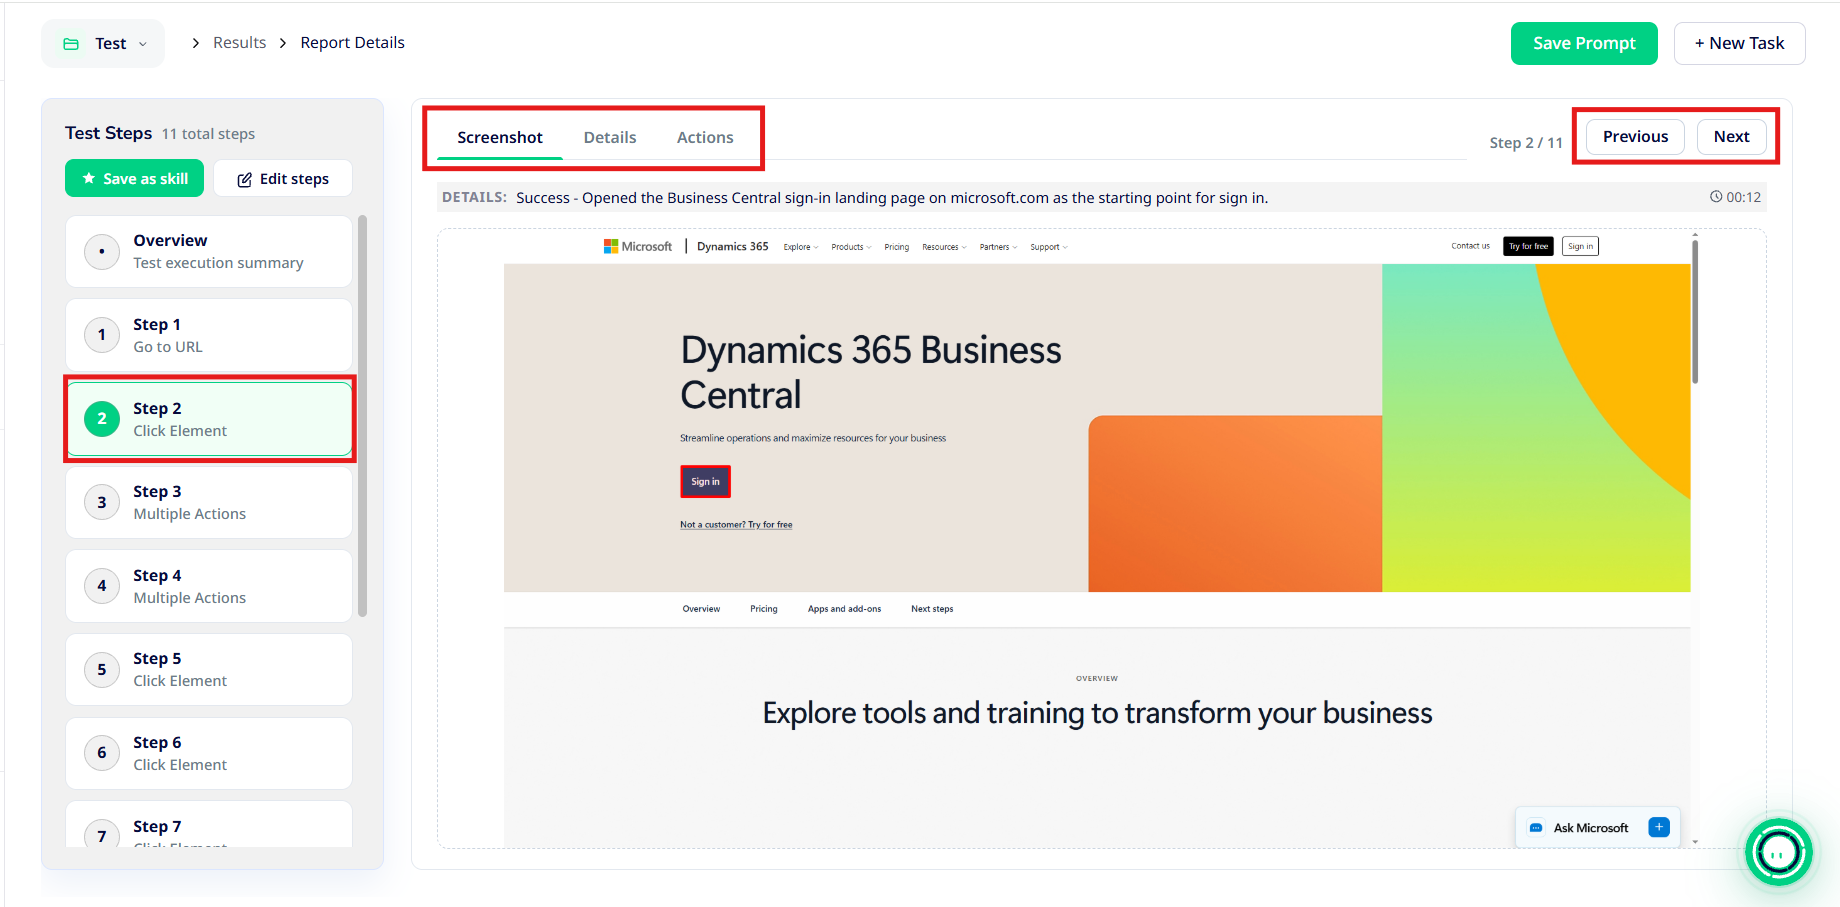
Step-by-Step Execution Details - The left navigation panel displays all steps performed during the test. Click any step to view three tabs:
- Screenshot - Displays a screenshot of the application captured during the selected execution step.
- Details - Provides information about the selected step, including Page URL, Current Thoughts, Next Action, Total Time Taken, Inference Time and Action Execution Time
- Actions - Displays the specific actions performed during the step, such as clicking buttons, entering text, or navigating between pages.
Use Previous and Next to navigate between execution steps.
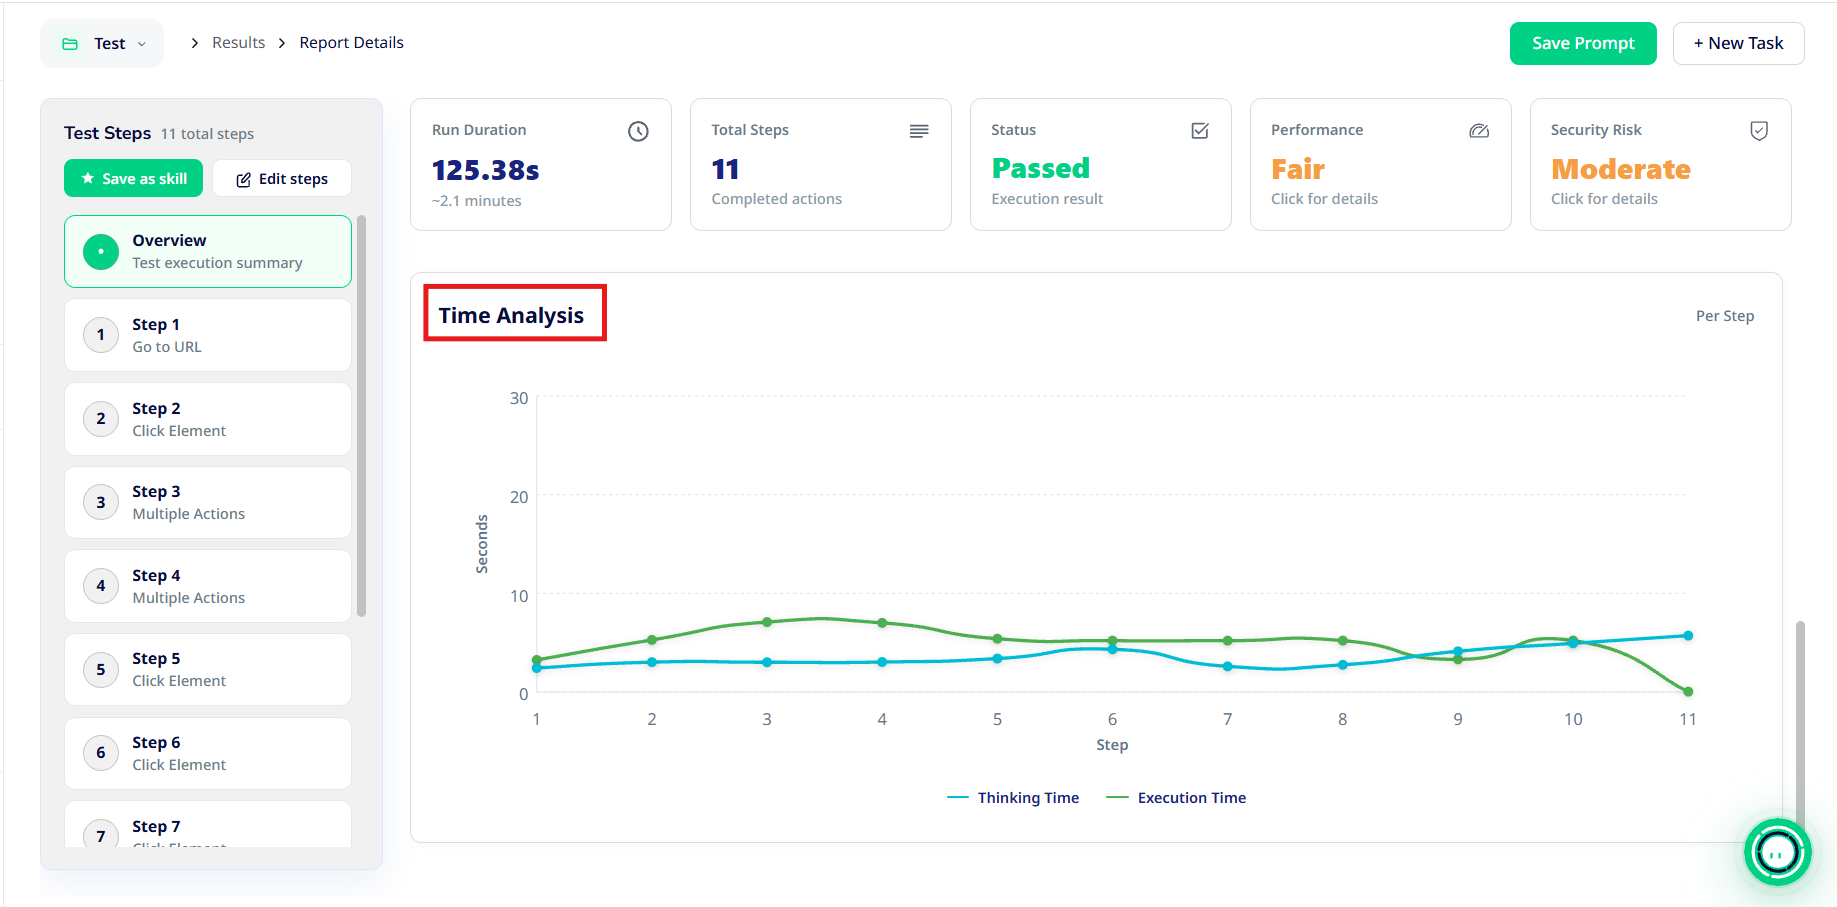
Time Analysis - The Time Analysis chart provides a step-by-step breakdown of execution time.
2. Understanding Performance
Web Agent provides performance analysis to help users understand how efficiently the tested application responds during execution. To access it, click the Performance indicator on the report overview.
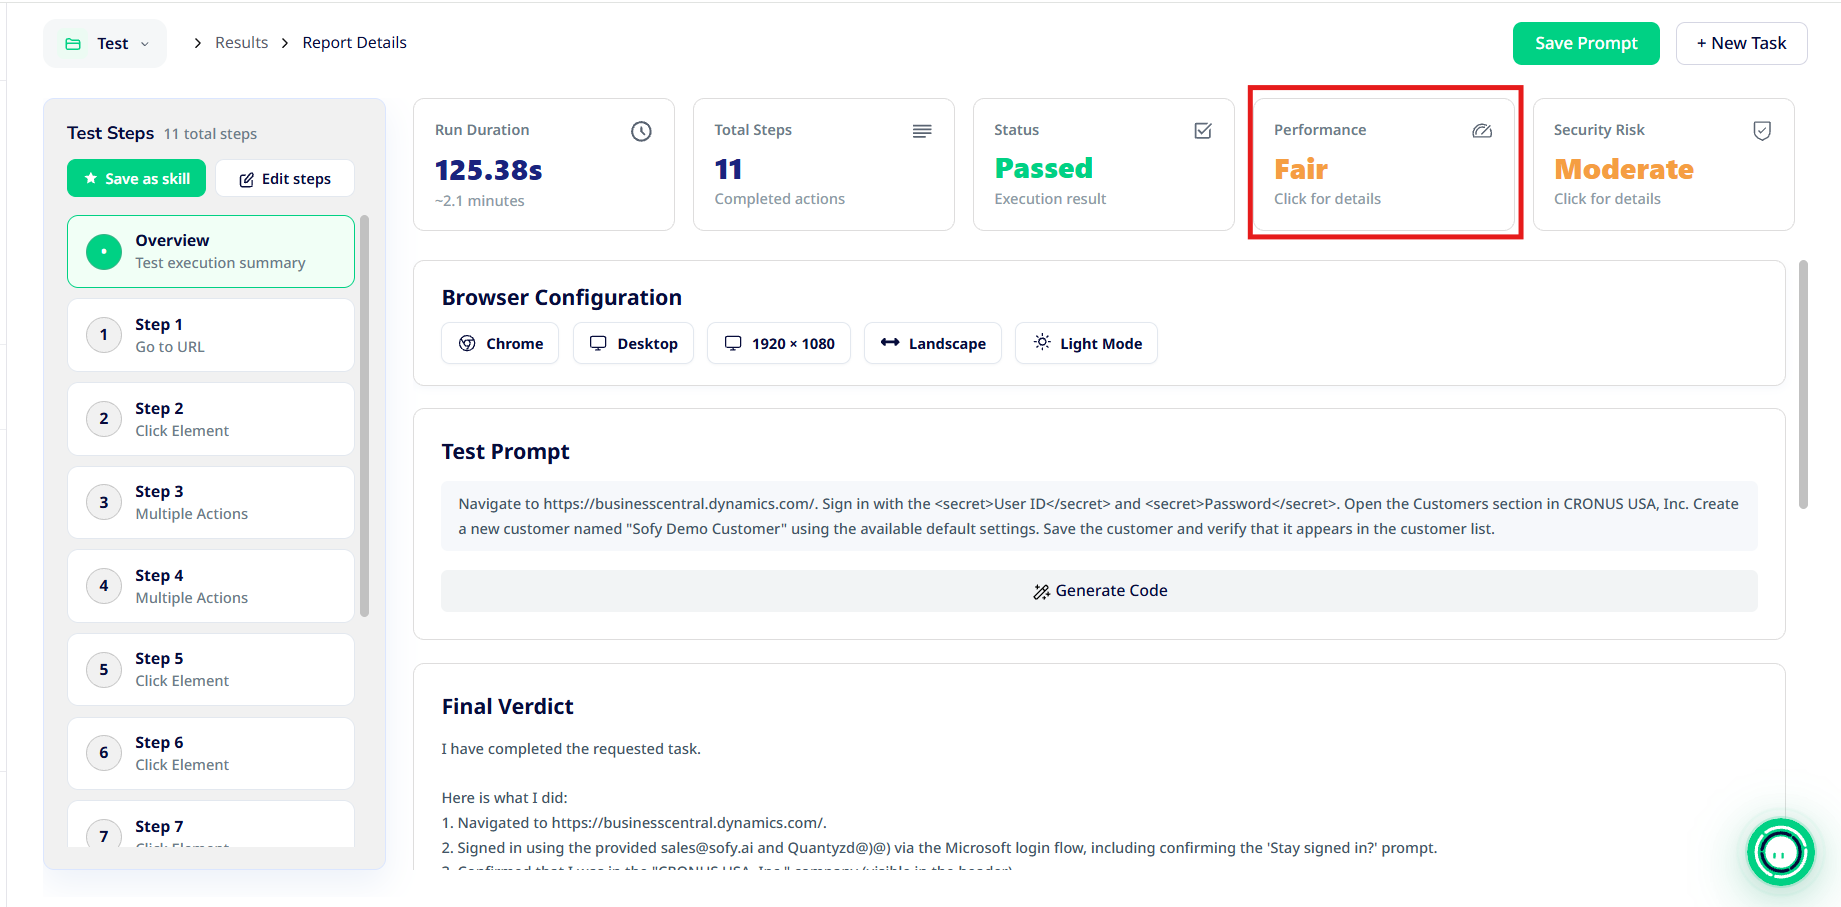
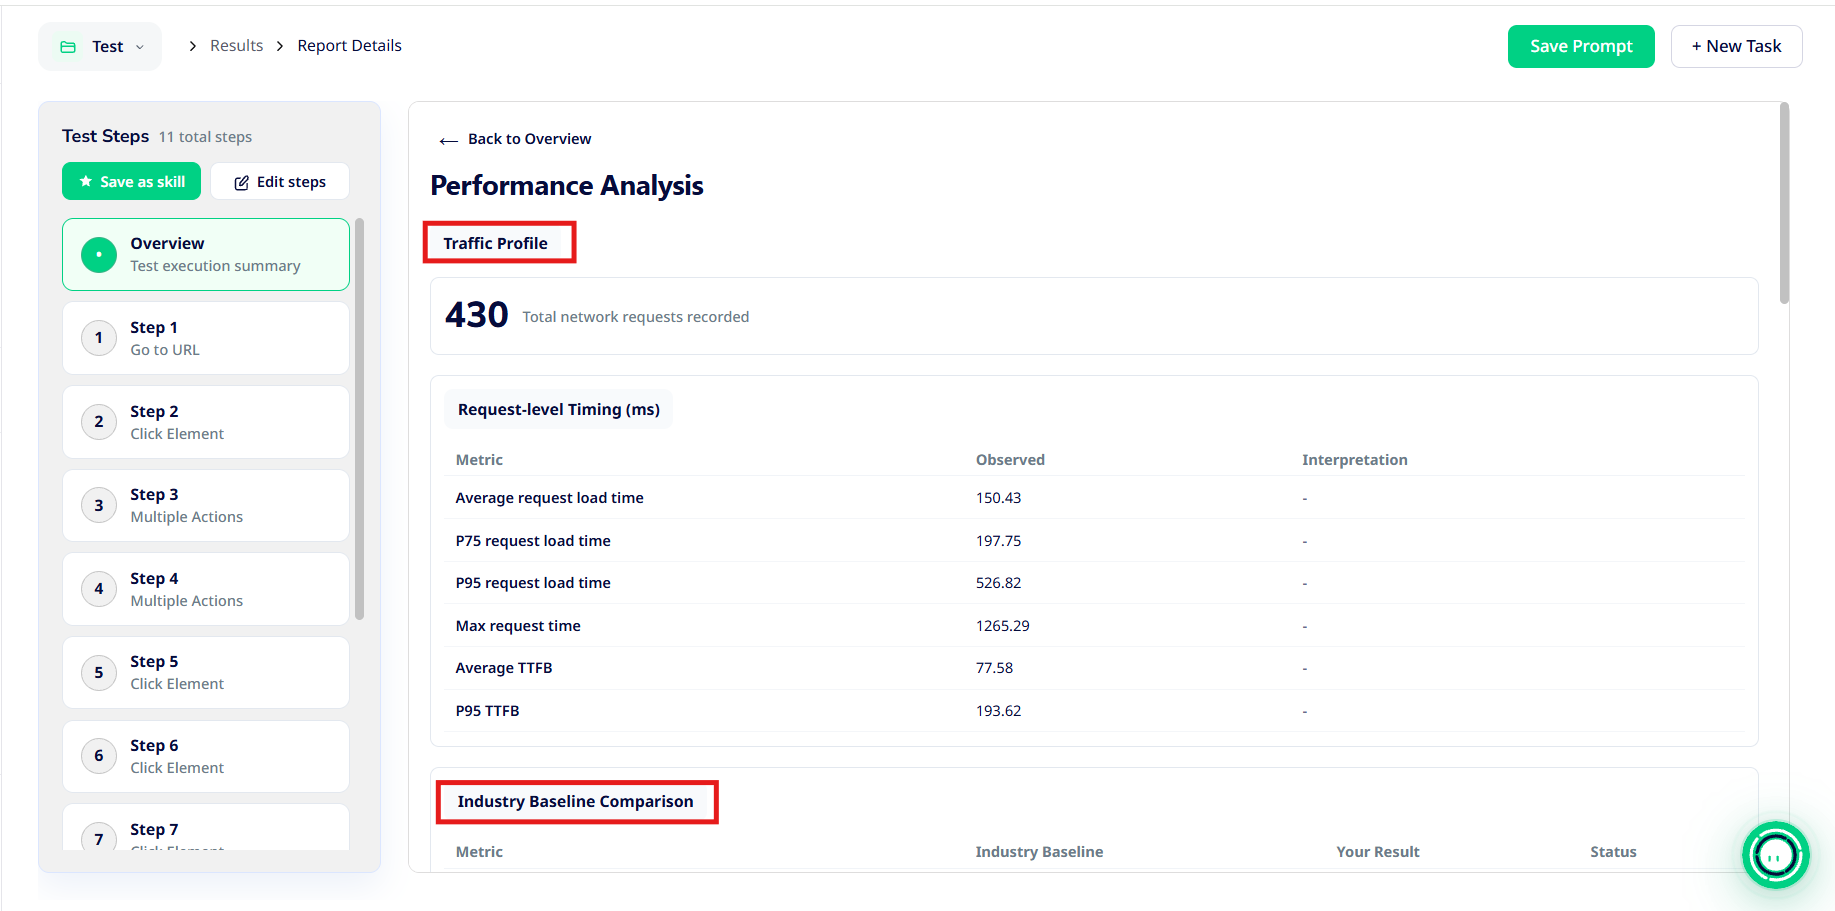
The Performance Analysis page includes the following sections.
Traffic Profile - Displays the total number of network requests recorded during test execution.
Request-Level Timing - This section provides important network performance metrics.
Industry Baseline Comparison - This section compares observed performance metrics against predefined benchmarks. Each metric includes the baseline, actual observed result, and performance status where available.
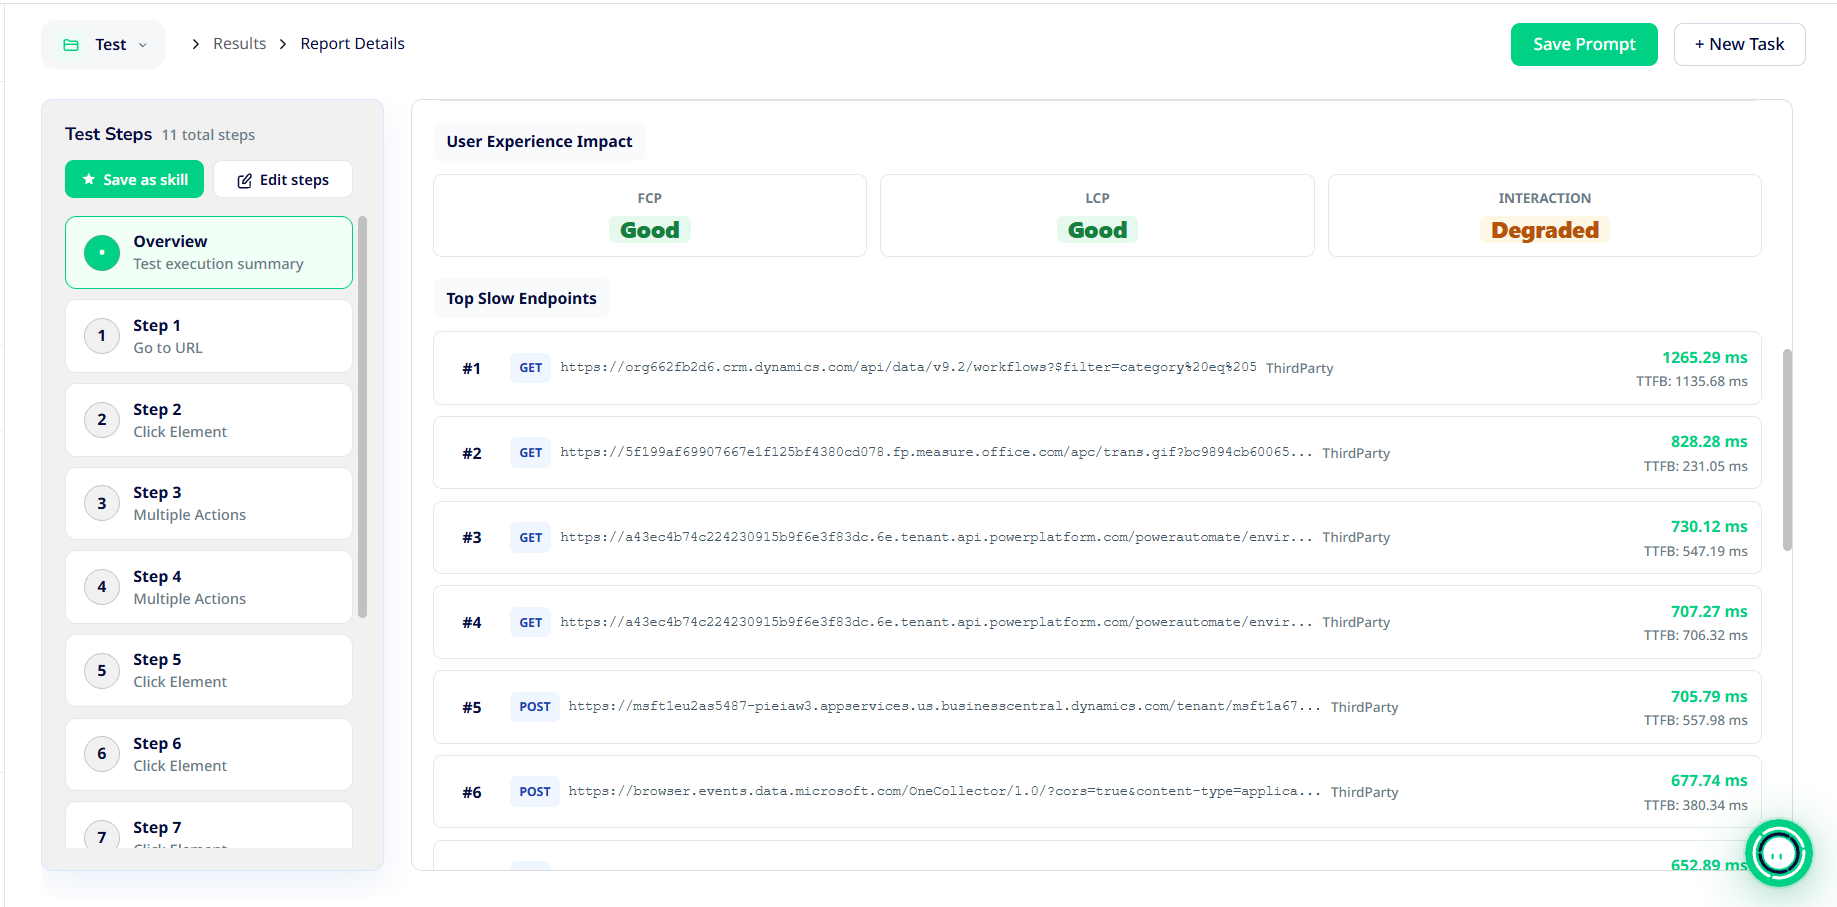
User Experience Impact
This section provides an assessment of key user-experience metrics.
- FCP (First Contentful Paint): Measures the time taken for the first visible content to appear on the page.
- LCP (Largest Contentful Paint): Measures the time taken for the largest visible content element to render.
- Interaction: Provides an assessment of application responsiveness during user interactions.
Top Slow Endpoints - This section identifies the slowest network requests recorded during execution.
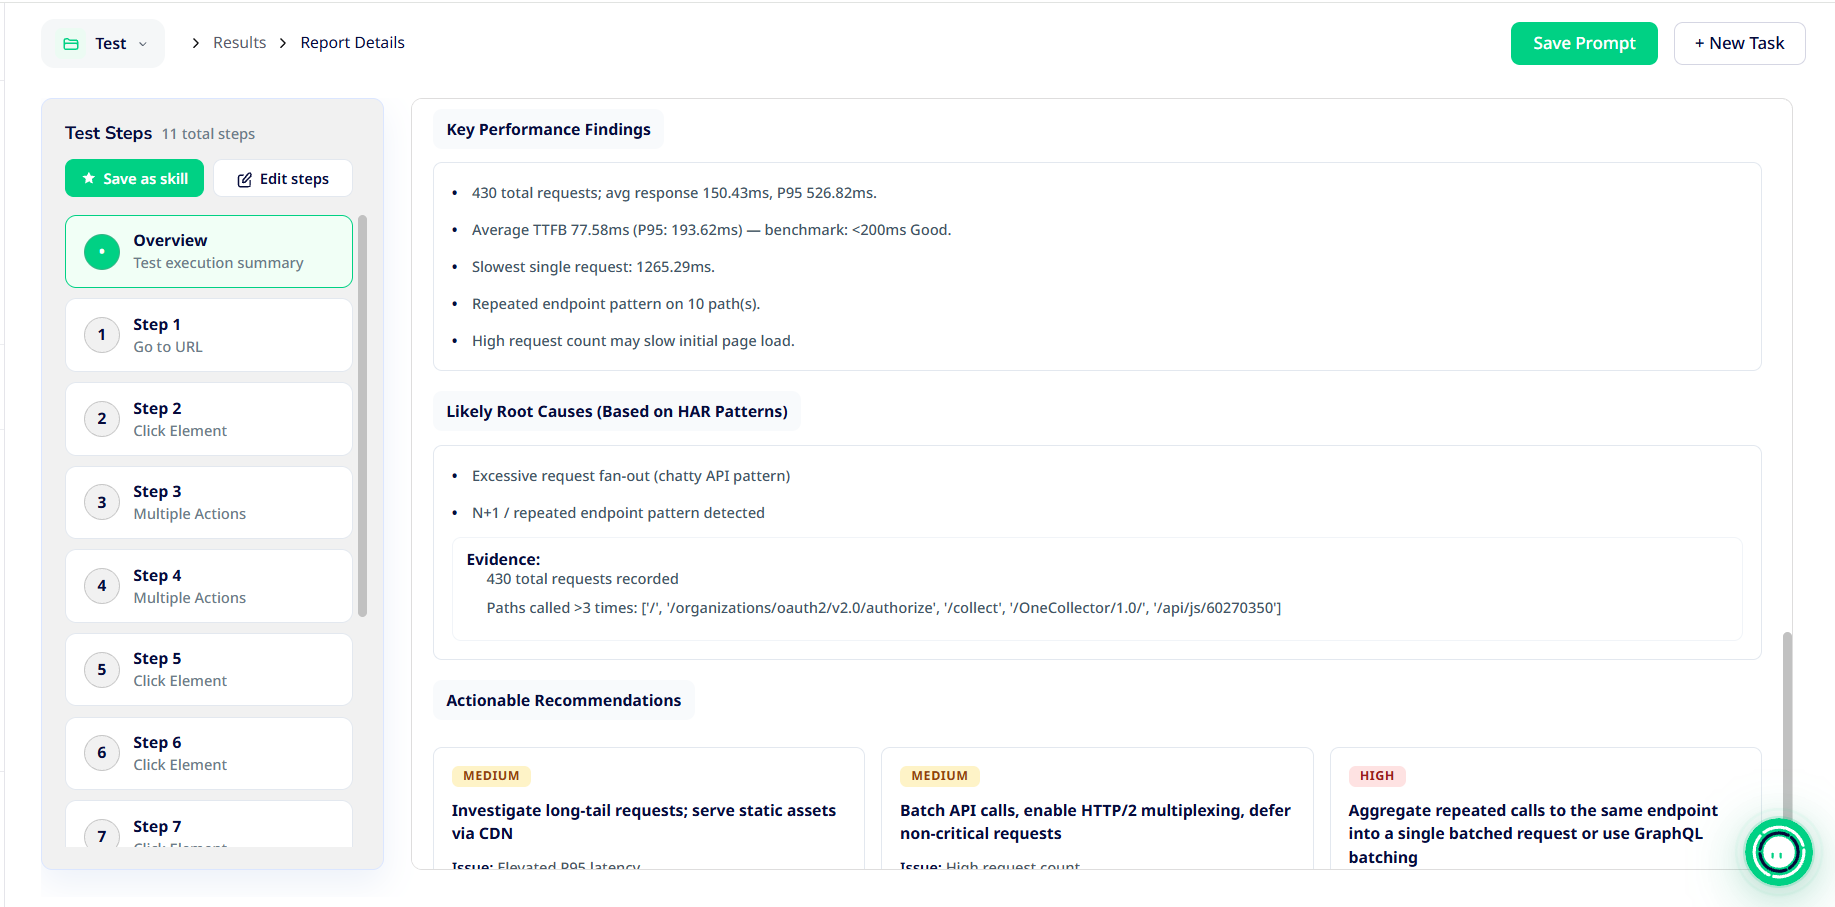
Key Performance Findings and Recommendations - Web Agent summarizes important performance observations. The Likely Root Causes section highlights possible contributing factors based on recorded network activity. The Actionable Recommendations section suggests potential improvements
3. Understanding Security
Web Agent provides a security analysis to help identify potential security risks observed during test execution. To access it, click the Security Risk indicator on the report overview.
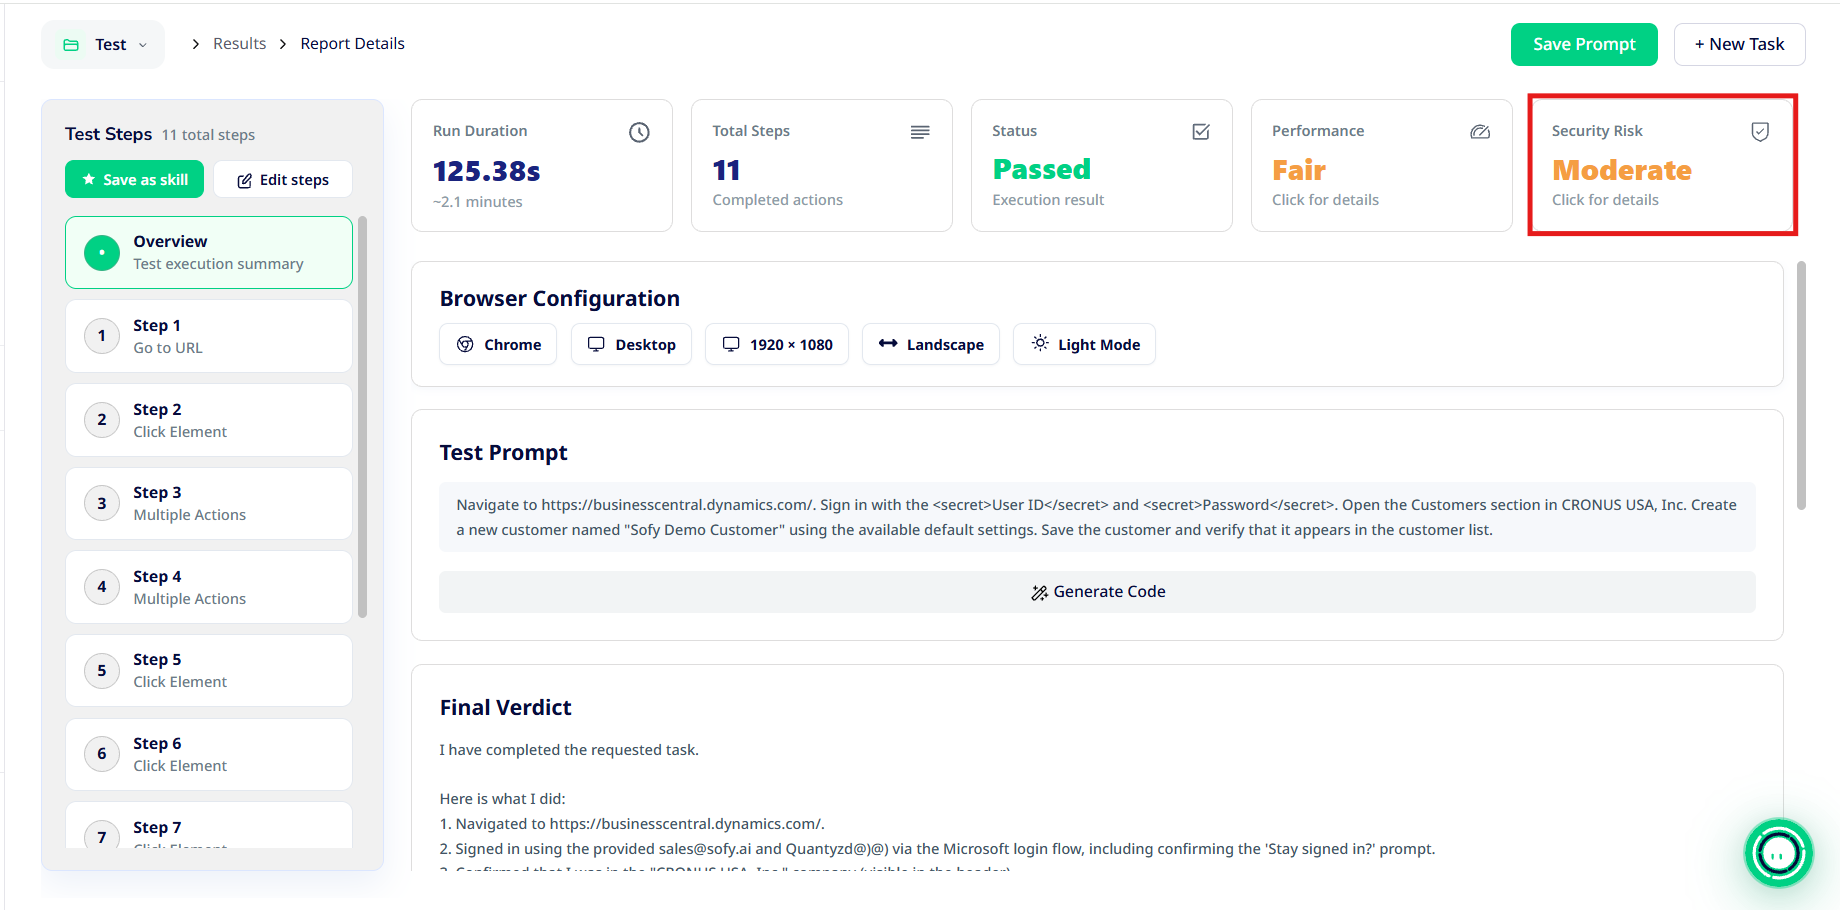
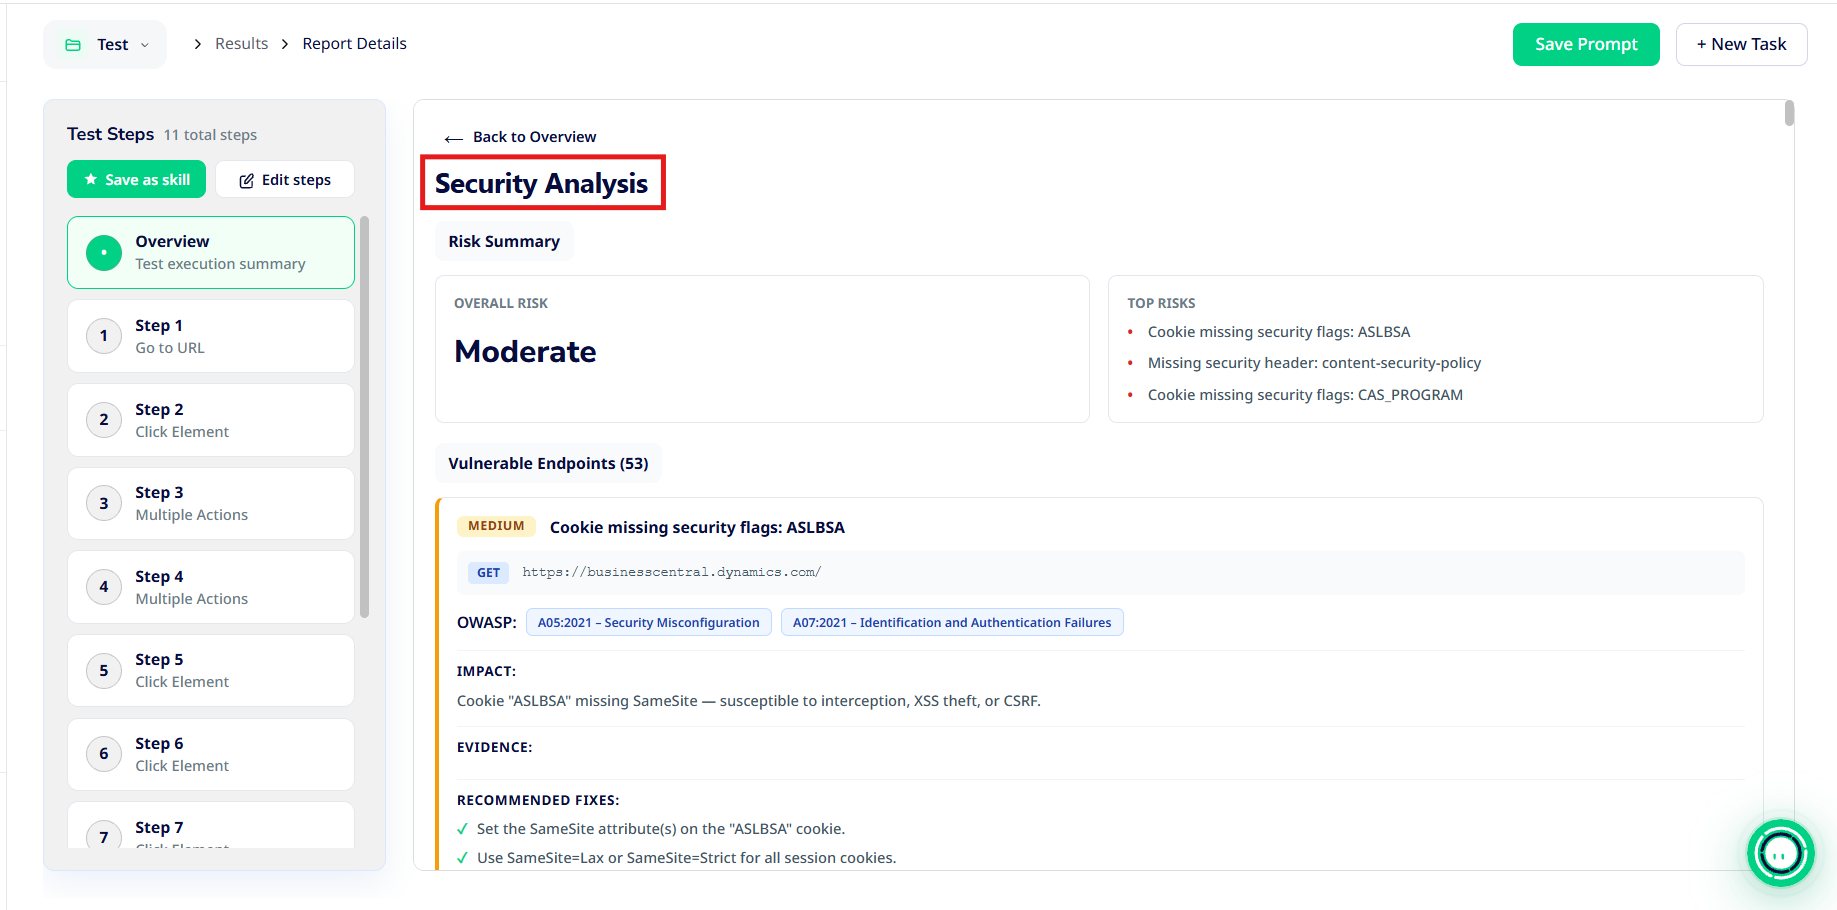
Security Risk Summary - The Security Analysis page displays the overall risk assessment and the top identified risks.
Vulnerable Endpoints - This section lists potential security vulnerabilities associated with network endpoints observed during execution.
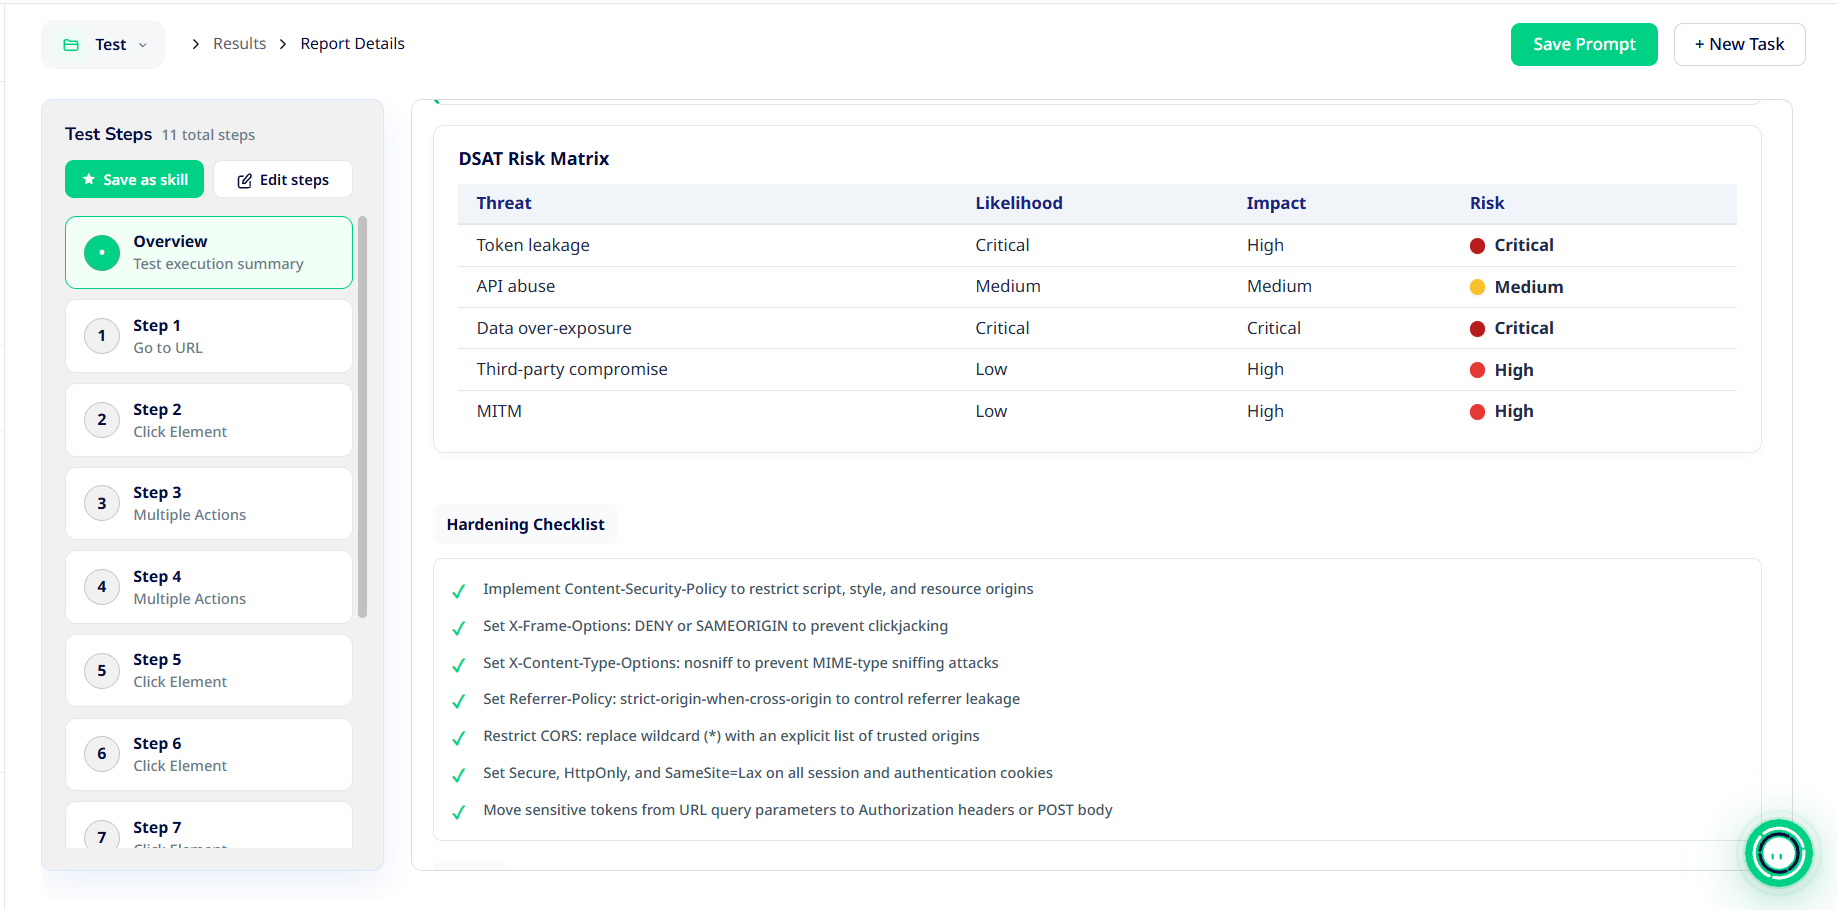
DSAT Risk Matrix - The DSAT Risk Matrix provides a structured assessment of potential security threats identified during the analysis.
Hardening Checklist - The Hardening Checklist provides recommended security improvements to help strengthen the application's security posture.
