Human in the Loop (HITL)

Human in the Loop (HITL) helps users monitor test regressions, investigate failures, and review potential self-healing opportunities. It provides visibility into detected regressions, AI-generated failure analysis, and resolution status, allowing users to investigate issues and take appropriate action.
HITL Triage
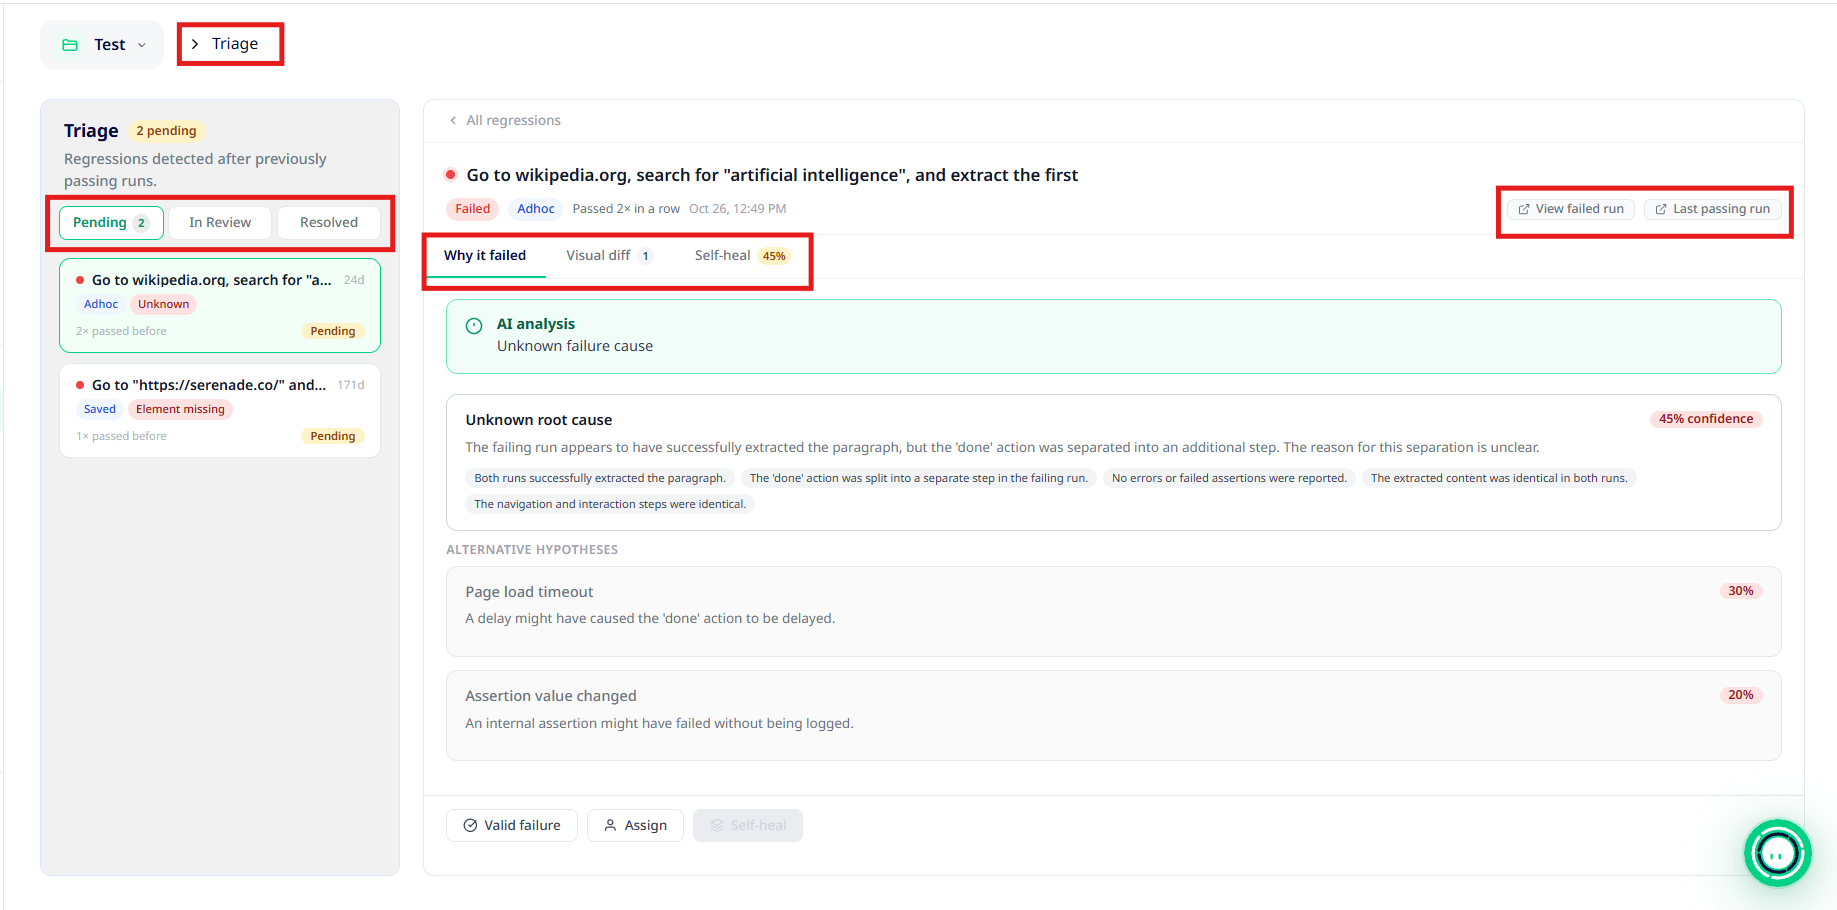
The Triage section allows users to investigate regressions detected during test execution. It provides AI-generated failure analysis, visual comparisons, and self-healing information to help determine whether human intervention is required.
Regression List
The left panel displays detected regressions, organized into three categories:
- Pending - Regressions awaiting review.
- In Review - Regressions currently under investigation.
- Resolved - Regressions that have been resolved.
Select a regression to view its detailed analysis. The selected regression displays information such as execution status, test type, previous successful runs, and available investigation details. Users can also access View Failed Run and Last Passing Run to review the corresponding test executions.
Why It Failed
The Why It Failed tab provides an AI-generated analysis of the selected regression. It includes:
- AI Analysis - Summary of the suspected failure cause.
- Root Cause - The most likely explanation for the regression, along with a confidence score.
- Confidence Score - Indicates the AI's confidence in its assessment.
- Alternative Hypotheses - Other possible explanations for the failure, along with their confidence scores.
This section helps users investigate potential causes of test failures.
Visual Diff
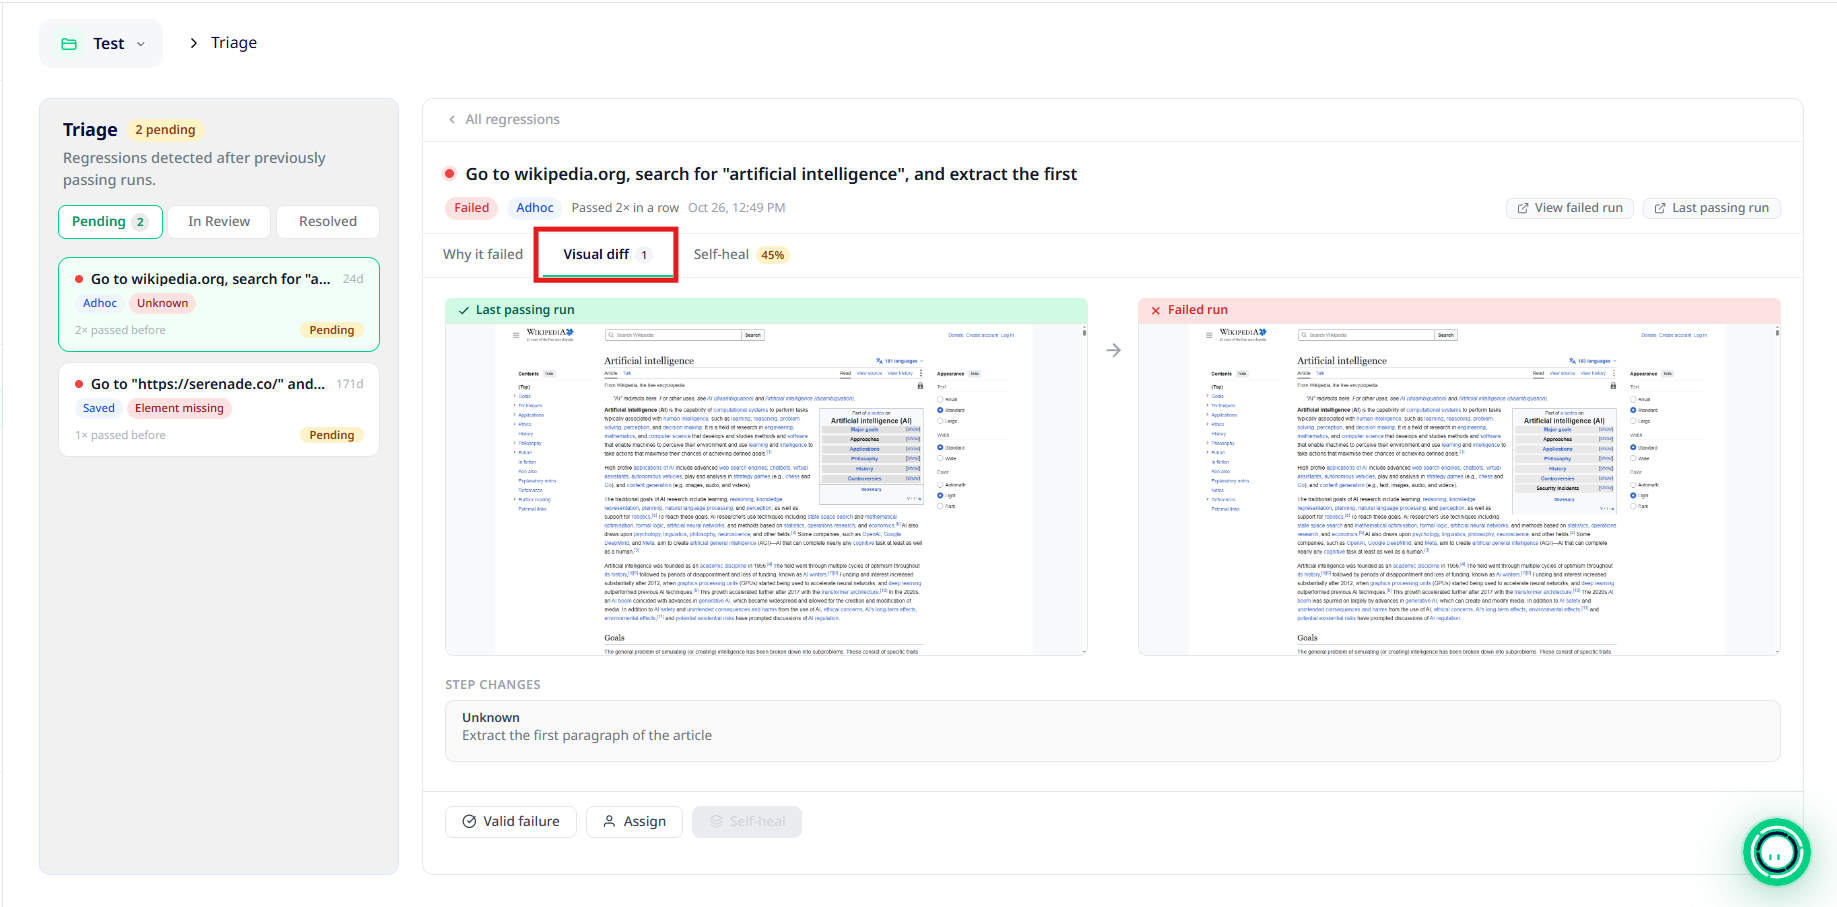
The Visual Diff tab allows users to compare screenshots from the last passing run and the failed run. It displays:
- Last Passing Run - Screenshot captured during the previous successful execution.
- Failed Run - Screenshot captured during the failed execution.
- Step Changes - Details of differences identified between the executions.
This comparison helps users identify visual or workflow changes that may have contributed to the regression.
Self-Heal
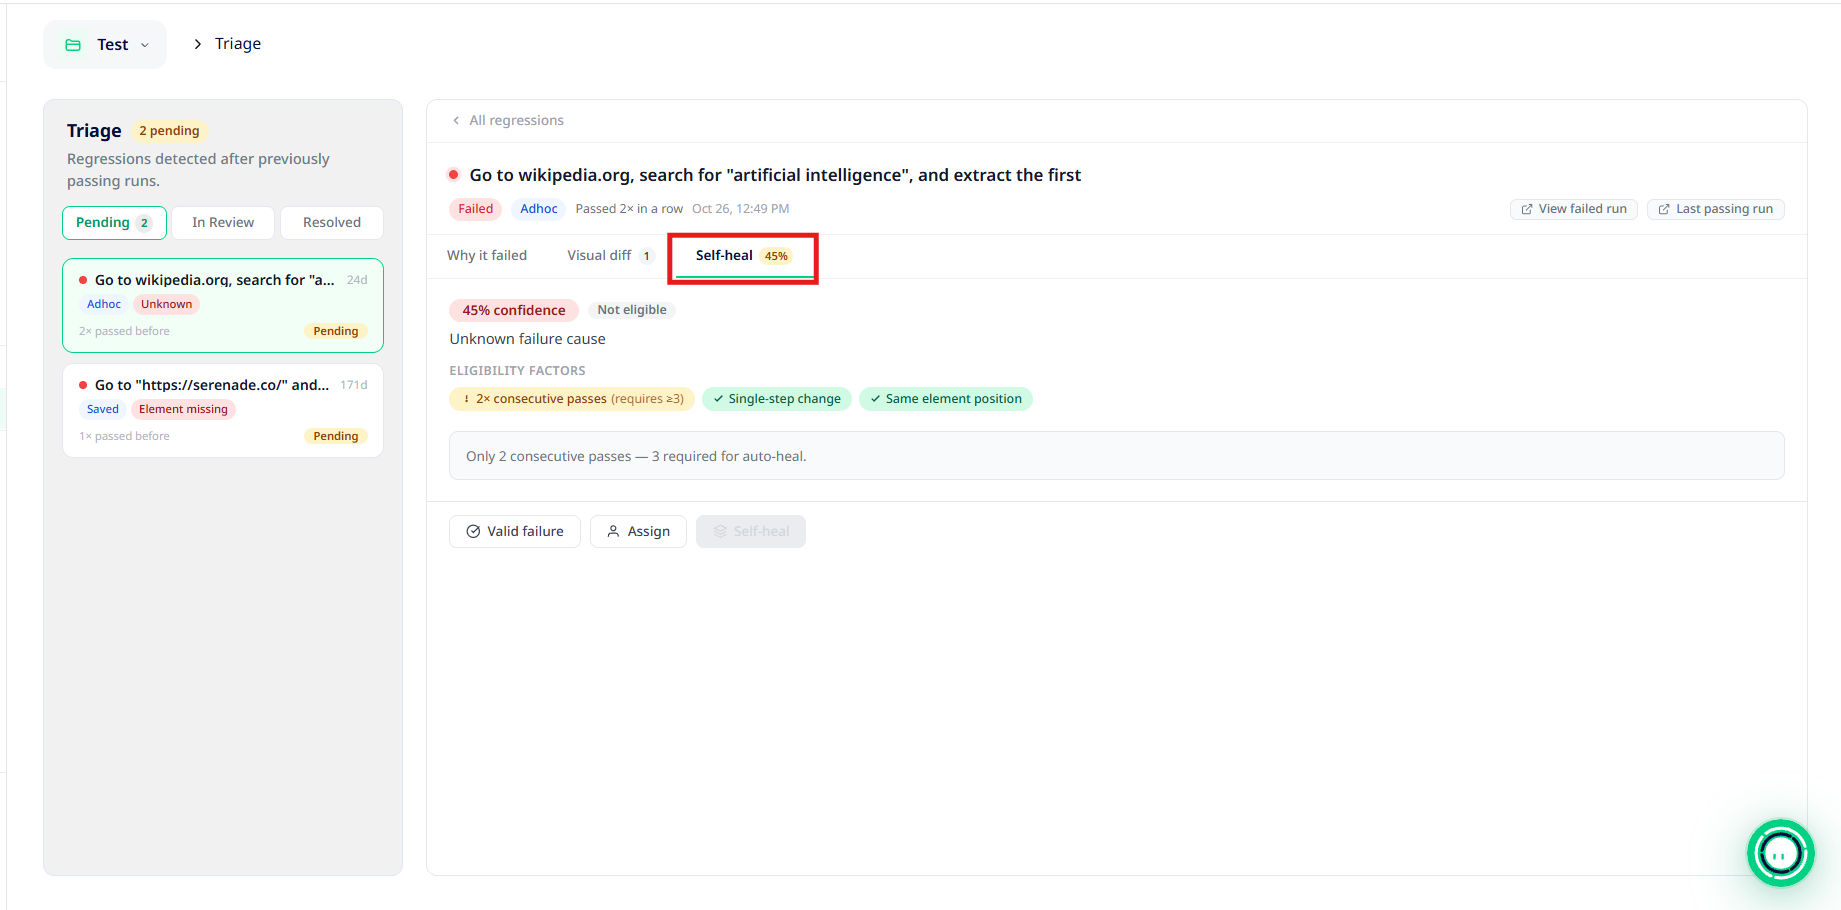
The Self-Heal tab provides an assessment of whether a detected regression is eligible for automated self-healing. It displays:
- Confidence Score - AI-generated confidence in the self-healing assessment.
- Eligibility Status - Indicates whether the regression qualifies for self-healing.
- Eligibility Factors - Conditions evaluated to determine self-healing eligibility.
If the required conditions are not met, the regression may be marked as Not Eligible, and the Self-Heal action will be unavailable.
Triage Actions
After reviewing the failure analysis, users can determine the appropriate next action.
- Valid Failure - Use this option when the detected failure has been reviewed and confirmed as genuine.
- Assign - The Assign option allows users to involve a human reviewer when additional investigation or intervention is needed.
- Self-Heal - When a regression meets the eligibility requirements, the Self-Heal option can be used to initiate automated recovery.
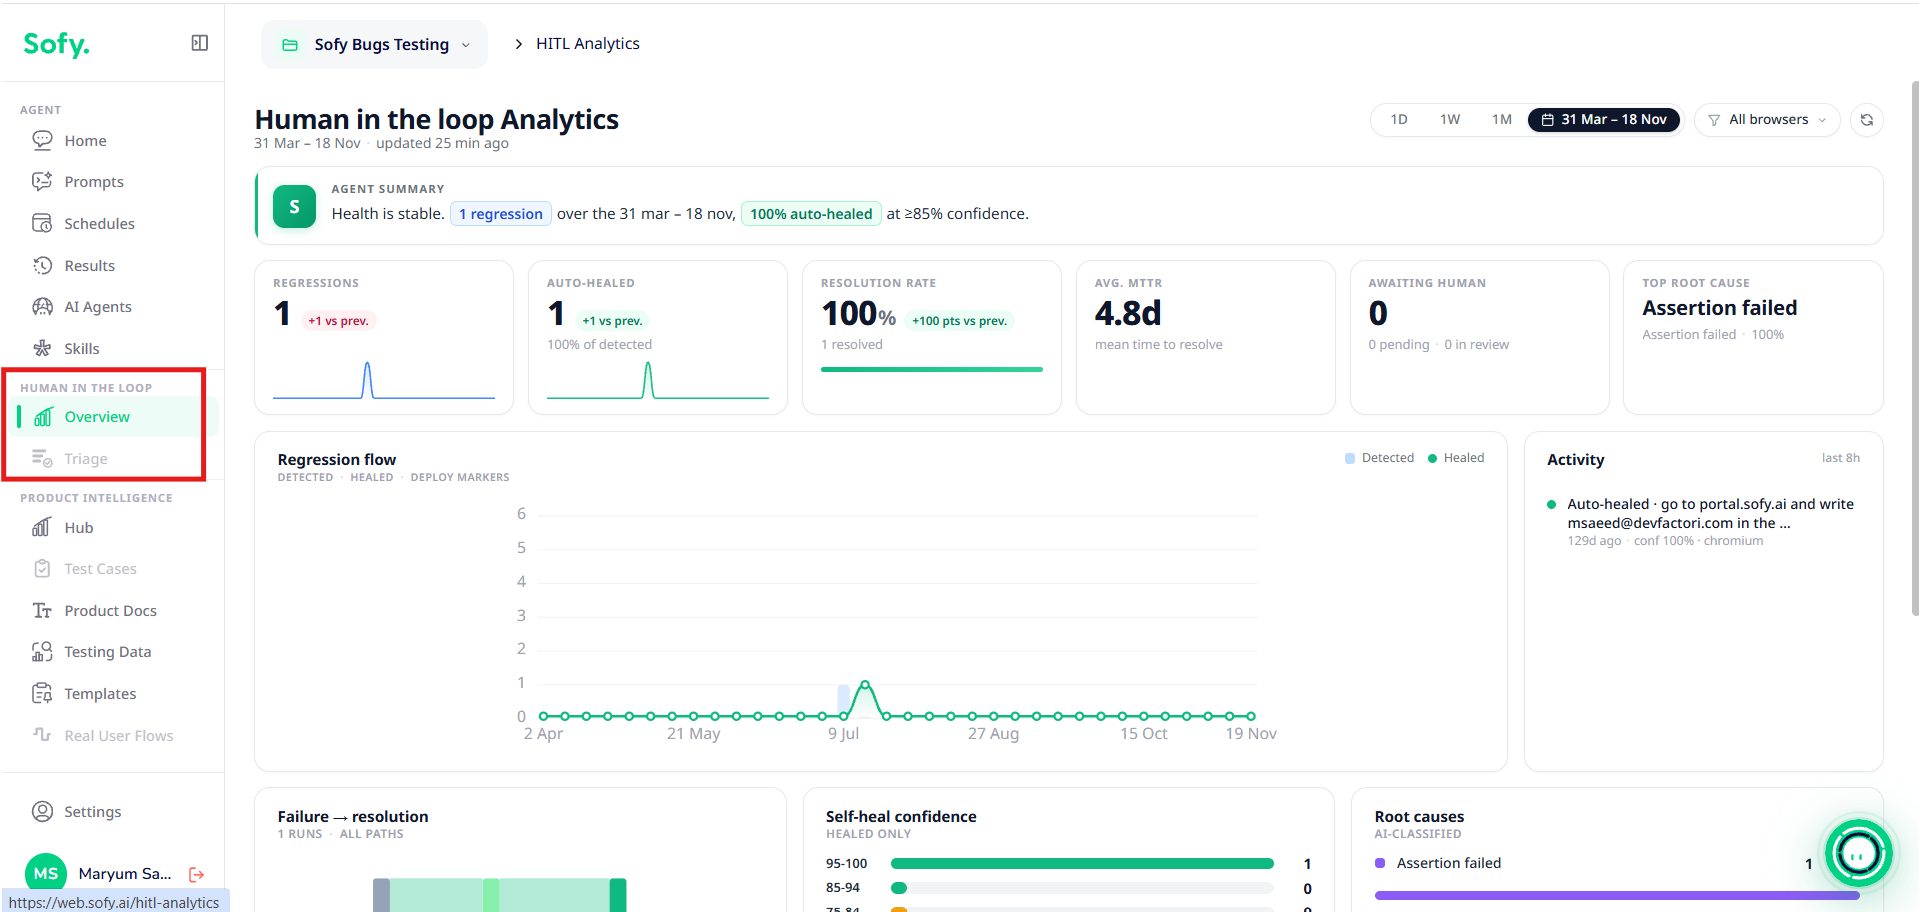
HITL Overview
The HITL Overview provides a centralized dashboard for monitoring regression detection, automated healing, resolution rates, and failure trends.
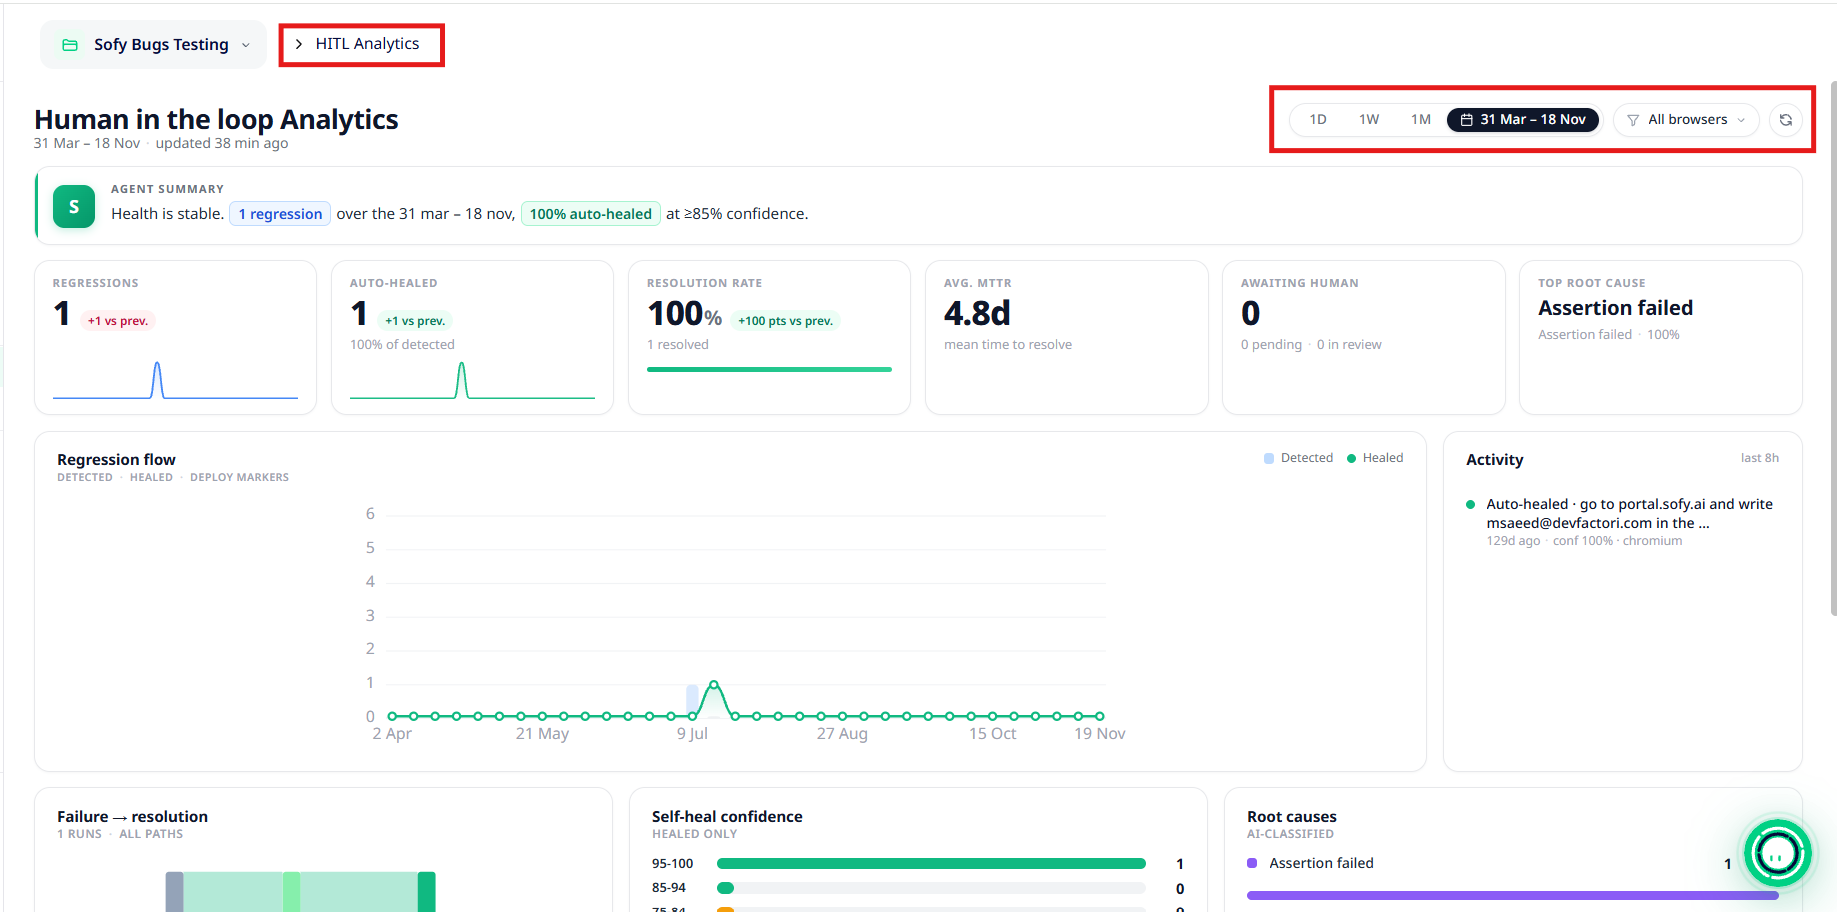
Dashboard Filters
At the top of the dashboard, users can filter analytics using:
- Time Range - View data for the last day (1D), week (1W), month (1M), or a custom date range.
- Browser - Filter results by browser.
- Refresh - Update the dashboard to display the latest available data.
Agent Summary
The Agent Summary provides a quick assessment of test health during the selected period. It highlights the number of regressions detected, the percentage automatically healed, and Self-healing confidence, where available.
Key Performance Indicators
- Regressions - Total number of regressions detected during the selected period.
- Auto-Healed - Number of regressions automatically healed by Sofy.
- Resolution Rate - Percentage of detected regressions that have been resolved.
- Avg. MTTR - Mean Time to Resolve, indicating how long it takes to resolve regressions.
- Awaiting Human - Number of regressions pending human review or currently under review.
- Top Root Cause - Most frequently identified root cause of detected regressions.
Regression Flow
The Regression Flow chart displays regression activity over the selected period. It displays:
- Detected - Regressions identified during test execution.
- Healed - Regressions resolved through self-healing.
Activity - The Activity section displays recent regression-related activity, helping users stay informed about updates and changes.
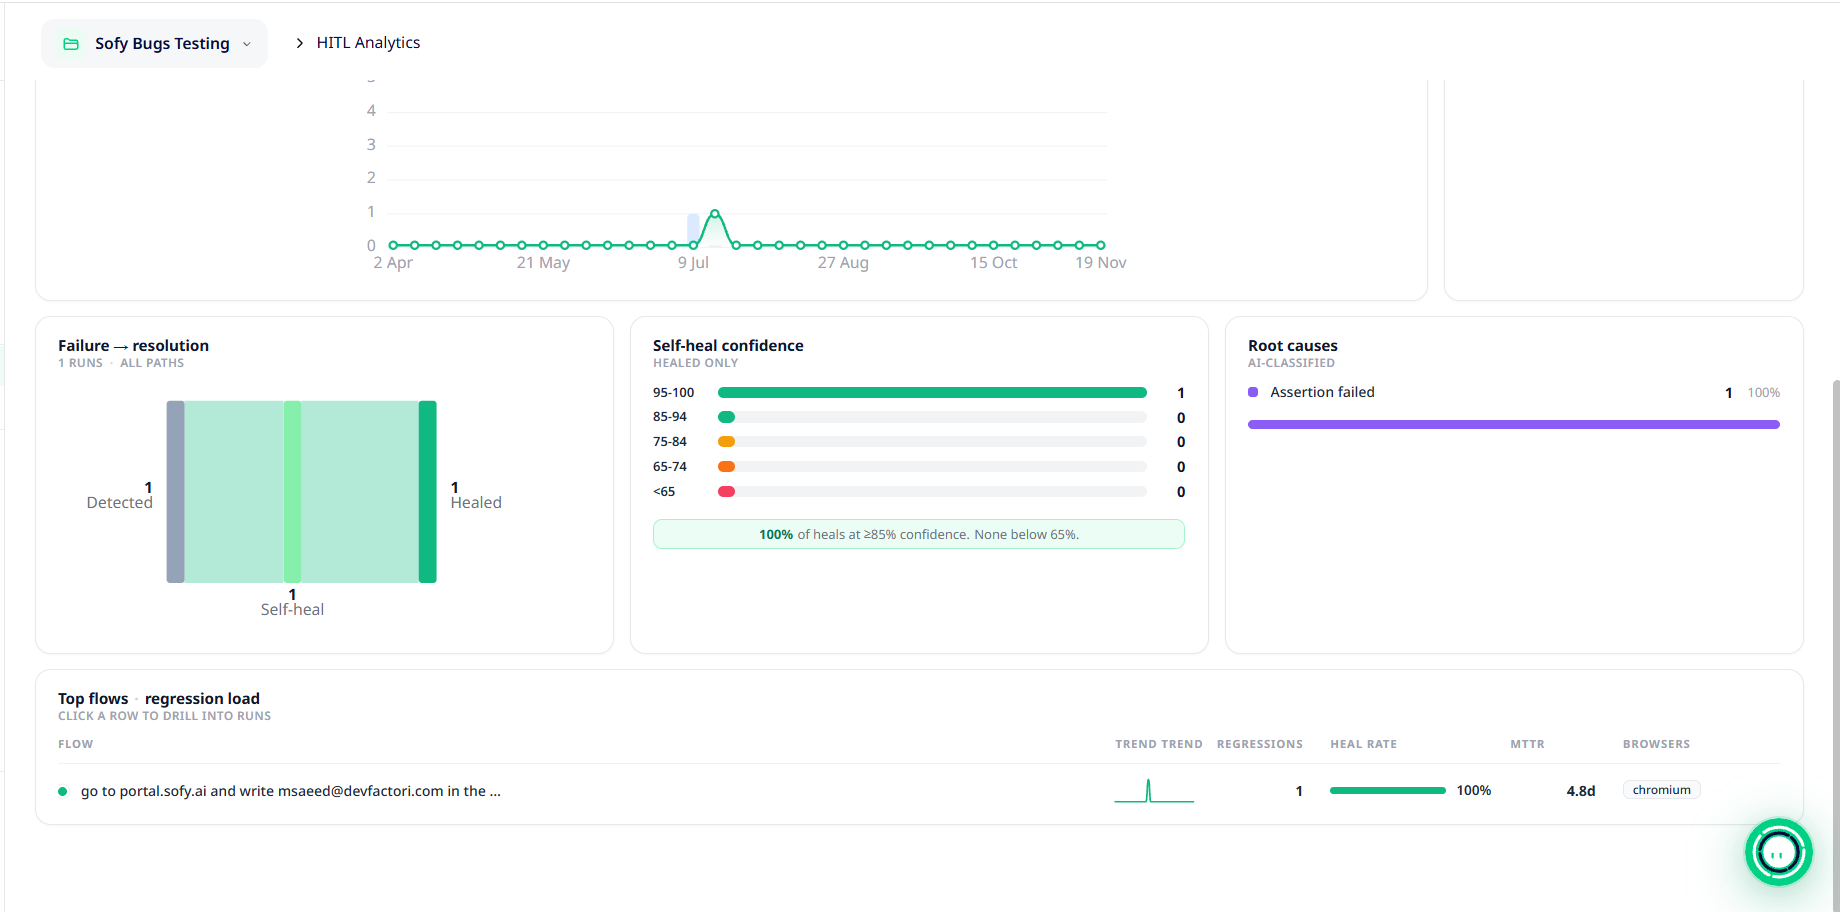
Failure → Resolution - This section provides visibility into the progression of failures toward resolution.
Self-Heal Confidence - The Self-Heal Confidence section displays the distribution of automatically healed regressions across different confidence ranges.
Root Causes - The Root Causes section displays AI-classified causes of detected regressions.
HITL Workflow: From Detection to Resolution
- Regression Detection - Sofy identifies a test that previously passed but has now failed.
- Failure Analysis - The Triage section provides AI-generated analysis, visual comparisons, and potential root causes.
- Review and Resolution - The regression may be reviewed by a human or addressed through self-healing when eligible.
- Analytics and Monitoring - The Overview dashboard provides visibility into detected regressions, healing activity, resolution rates, and root cause trends.
