Schedule Run - From Initialization to Completion

This guide will help you navigate how a scheduled run executes from inception to completion.4
The schedule run process operates across three hierarchical levels. Below is a comprehensive guide to each status at every level.
How to Visualize the Run
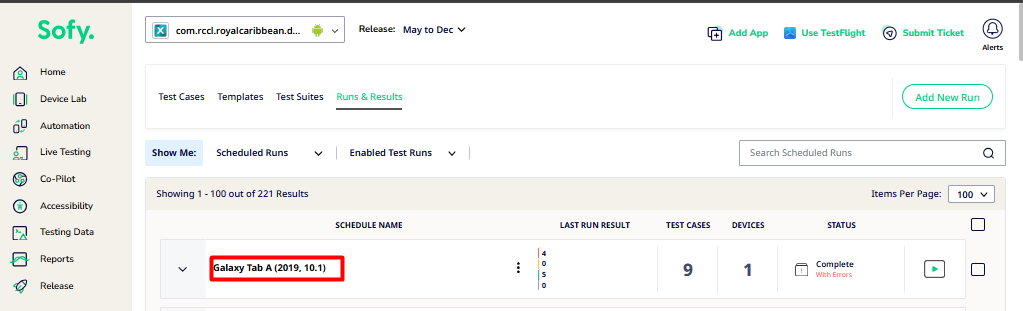
Go to Automation from the left navigation panel
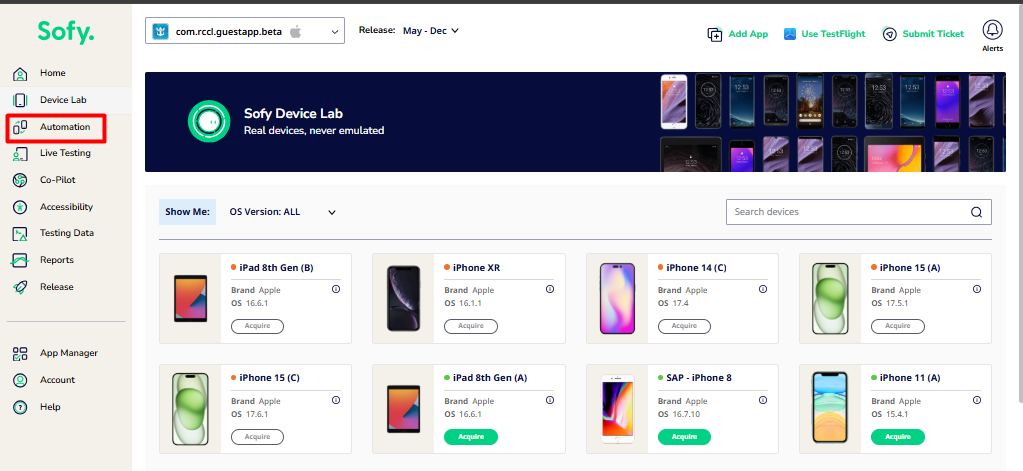
Select the Runs & Results tab to view the list of all schedule runs.
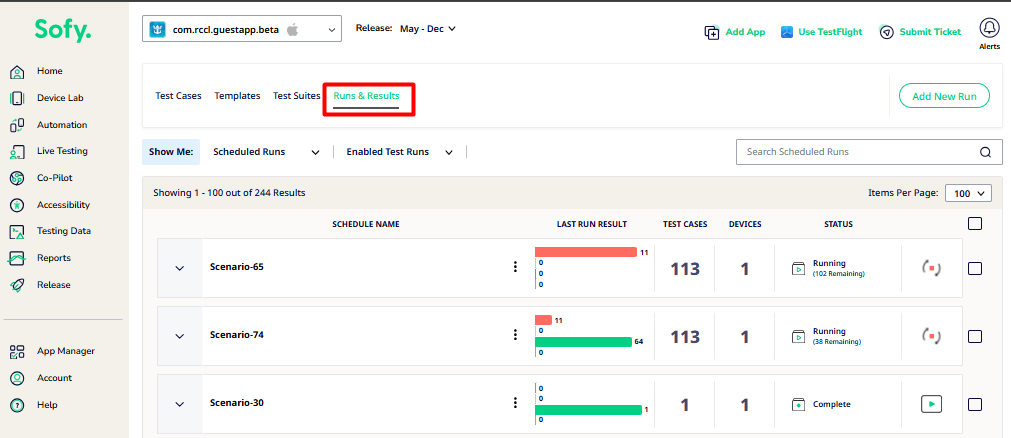
This represents the overall status of the entire test schedule.
Status | Description |
Scheduled | The schedule is created and will be triggered at a future time. 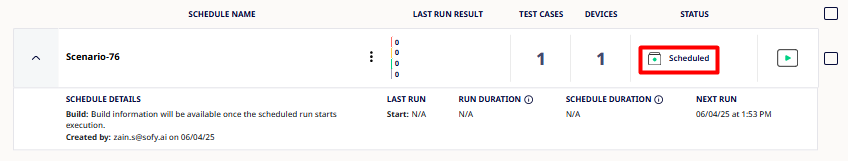 |
In Queue | The schedule has reached the device farm and is waiting for device allocation. 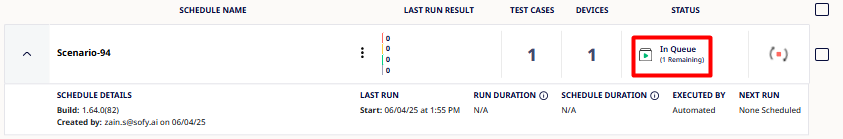 |
Running | Schedule execution has started and includes the following steps: device setup, app installation, test case execution, retries, and result upload. 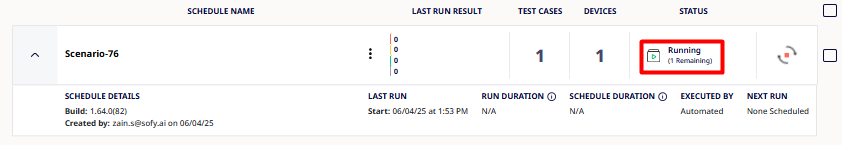 |
Finalizing | Schedule execution has completed, and final operations like report generation or log uploads are in progress. 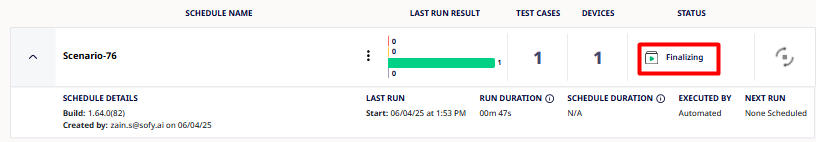 |
Complete | Schedule completed successfully. All test cases either passed or passed with warnings. 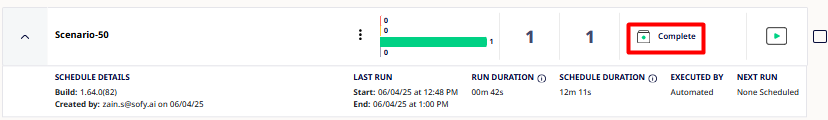 |
Stopped by User | Execution was manually stopped by the user during the run. 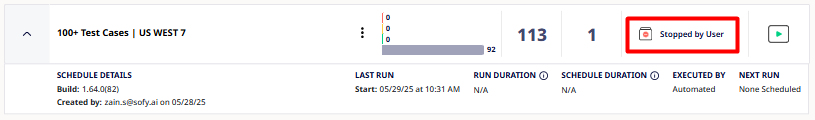 |
Cancelled by User | Execution was manually cancelled by the user while still in the queue. 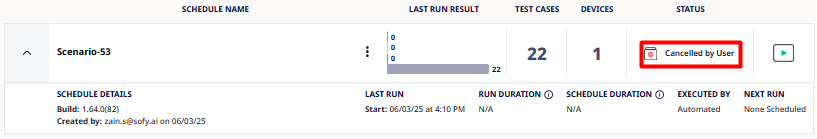 |
Complete with Errors | Schedule completed but contains failed, incomplete, or not executed test cases. 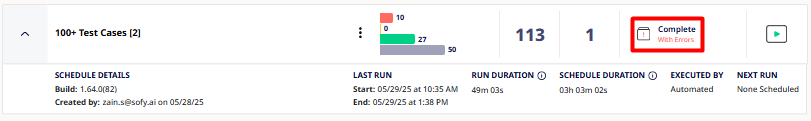 |
Click on a Schedule Name from the list to view details of its test runs.
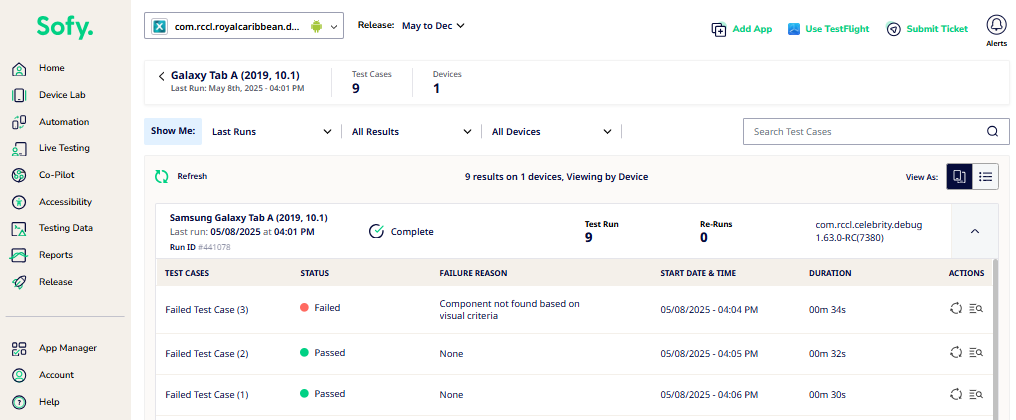
Execution statuses of an individual test run within the schedule.
Status | Description |
Waiting for Device | The test run is queued and waiting for device allocation. 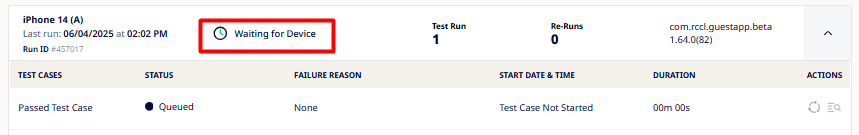 |
Setting up Device | Device controller and environment setup in progress. 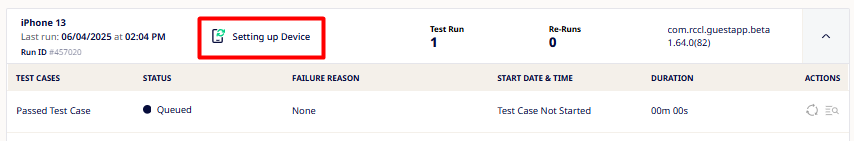 |
Downloading App | Application binary is being downloaded onto the test device. 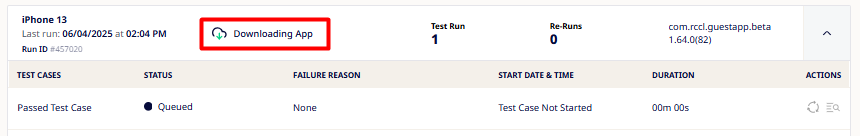 |
Parsing App | The application is being loaded and analyzed before installation. |
Loading Scenarios | Test Cases are being loaded and prepared for execution. |
In Progress | Test case execution is underway. 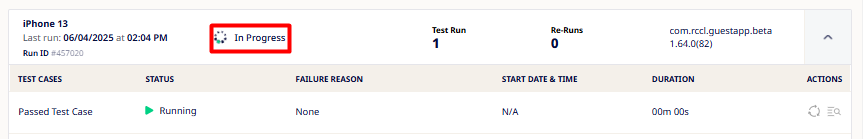 |
Complete | Test run completed successfully with all test cases either passed, failed or passed with warnings. 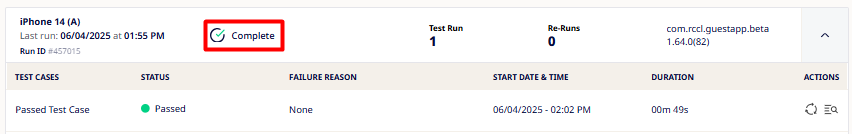 |
Stopped by User | Execution was manually stopped by the user during the run 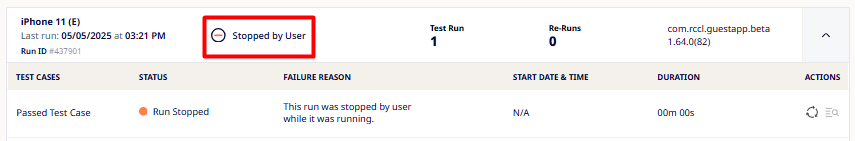 |
Not Executed | Test run not executed due to issues like: Concurrent session limits, App installation failure, Device/Appium server disconnection, Internal errors or Timeouts 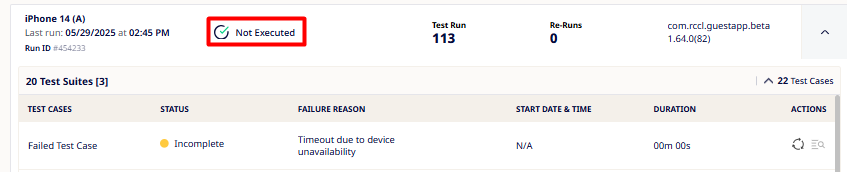 |
Complete with Errors | Test run executed but includes failed, incomplete, or not executed test cases. 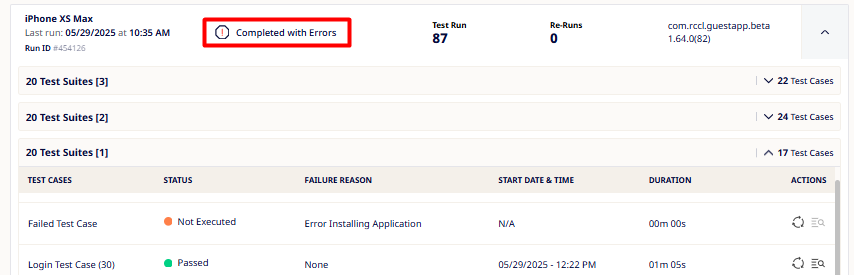 |
Granular status and results of individual test cases within a test run.
Status | Description |
Queued | The test case is waiting for device execution. 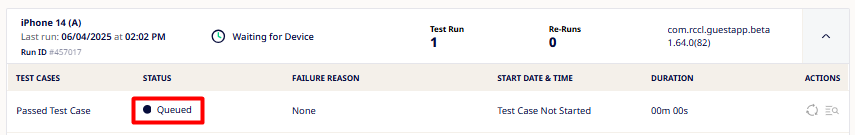 |
Running | Test case execution in progress. 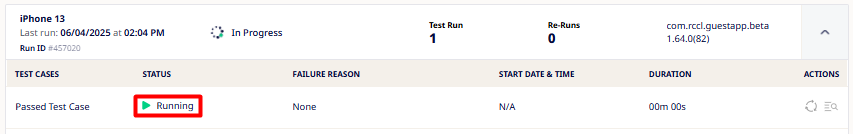 |
Passed | Test case executed and passed successfully. 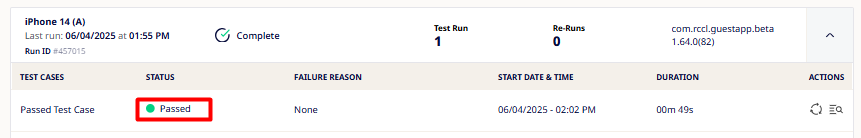 |
Passed with Warnings | The test case passed but encountered one or more non-critical warnings during execution. 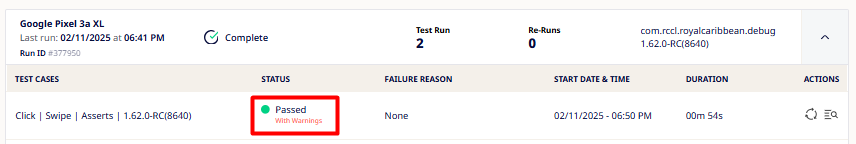 |
Failed | The test case failed during execution. 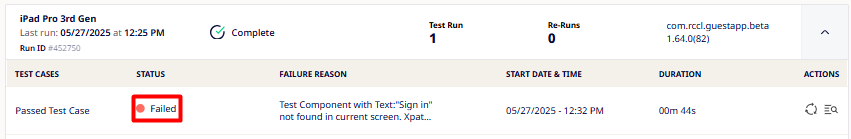 |
Incomplete | The test case was interrupted due to a timeout or unexpected issue. 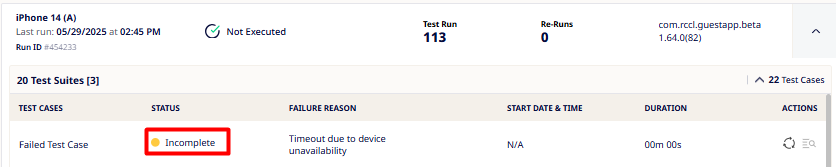 |
Not Executed | Test case not executed due to: Session limits, App installation issues, Device/Appium server disconnection or Internal error.  |
Run Stopped | Execution was manually stopped by the user while this test case was running. 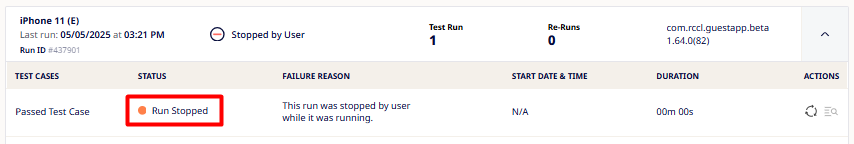 |
Run Cancelled | Execution was cancelled before this test case started. 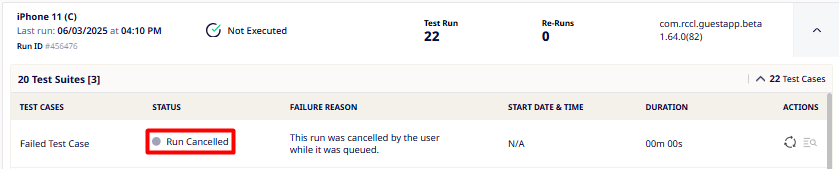 |
Failure Reasons - Descriptions
These are the common failure reasons encountered during schedule or test execution. Each reason may indicate an infrastructure, configuration, or environment-level issue.
Failure Reason | Description |
Application Launch Failure | The app was installed but failed to launch on the test device.  |
Failed to Parse App | The system was unable to analyze the app before installation. This can occur due to corrupt APK/IPA files, provisioning issues or Invalid certificates. 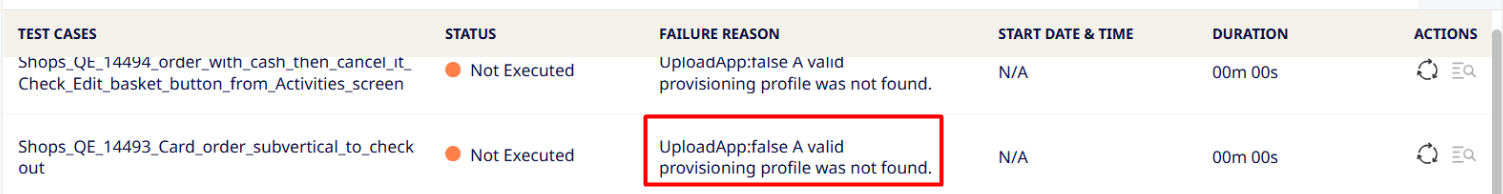 |
Automation Server Disconnection | The automation framework (e.g., Appium) lost connection during test execution. This may be caused by network issues or server crashes.  |
Timeout – Device Offline | The assigned device went offline unexpectedly. After waiting for up to 2 hours for it to come back online, the run timed out with a "Timeout – Device Offline" error. 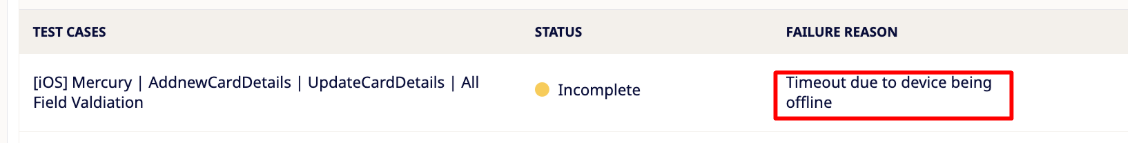 |
Internal Error | An unexpected system-level issue occurred during execution. Logs should be reviewed for more details. 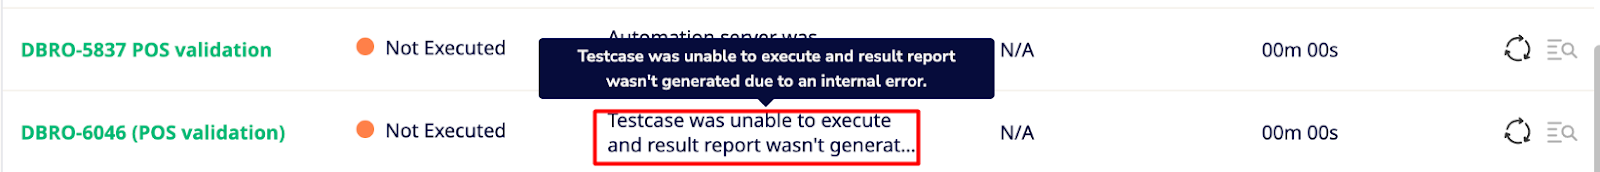 |
Failed Device Communication Error | The platform was unable to communicate with the device, possibly due to network disruption, service crashes or device health issues. 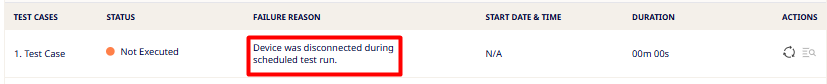 |
Timeout – Device Farm Down | The device farm infrastructure was temporarily unavailable or unresponsive, causing the test to timeout.  |
Sofy Device Service Interruption | A temporary Sofy service interruption caused by a brief network disruption. 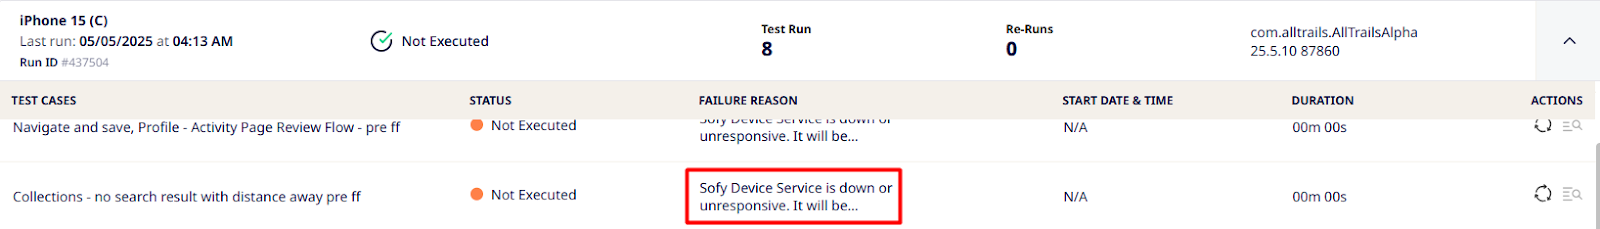 |
Timeout – Device Unavailability | The assigned device was already in use by another session or schedule. After waiting for up to 2 hours for the device to become available, the run timed out with a "Timeout – Device Unavailability" error. 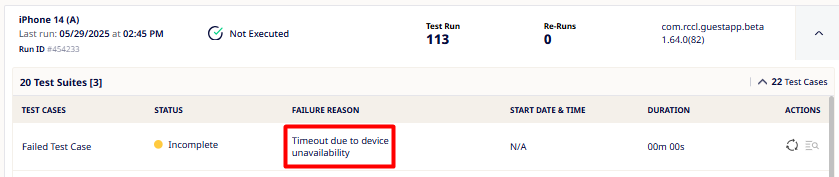 |