How to Evaluate your Test Results - A Detailed Guide

Test Case Result Accessibility Matrix
Test Case State | Result Generation | Result Accessibility |
Ready | Results are automatically generated after lab completion and are available in both Lab Run and Portal views | Lab & Portal |
Draft | Results are generated only after execution completion in lab environment. Draft test cases are exploratory tests that are still being developed or refined | Lab Only |
Test Run Result Categories
Result Status | Description | Result Accessibility |
  | All steps executed successfully without any issues. | Accessible |
  | Test case passed but encountered soft assertion failures. | Accessible |
  | One or more steps failed due to functional/UI errors. | Accessible |
 | Tests did not complete (e.g., crash, timeout, or manual stop). | Not Accessible |
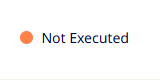 | Tests did not start. This includes test cases that were included in a scheduled run but later changed to Draft state. In scheduled runs, Draft test cases are not executed. | Not Accessible |
Understanding Lab Run Results: After accessing the Lab Run Result Listing, you will see a detailed list of all test runs executed manually in Lab. Each row provides insights such as:
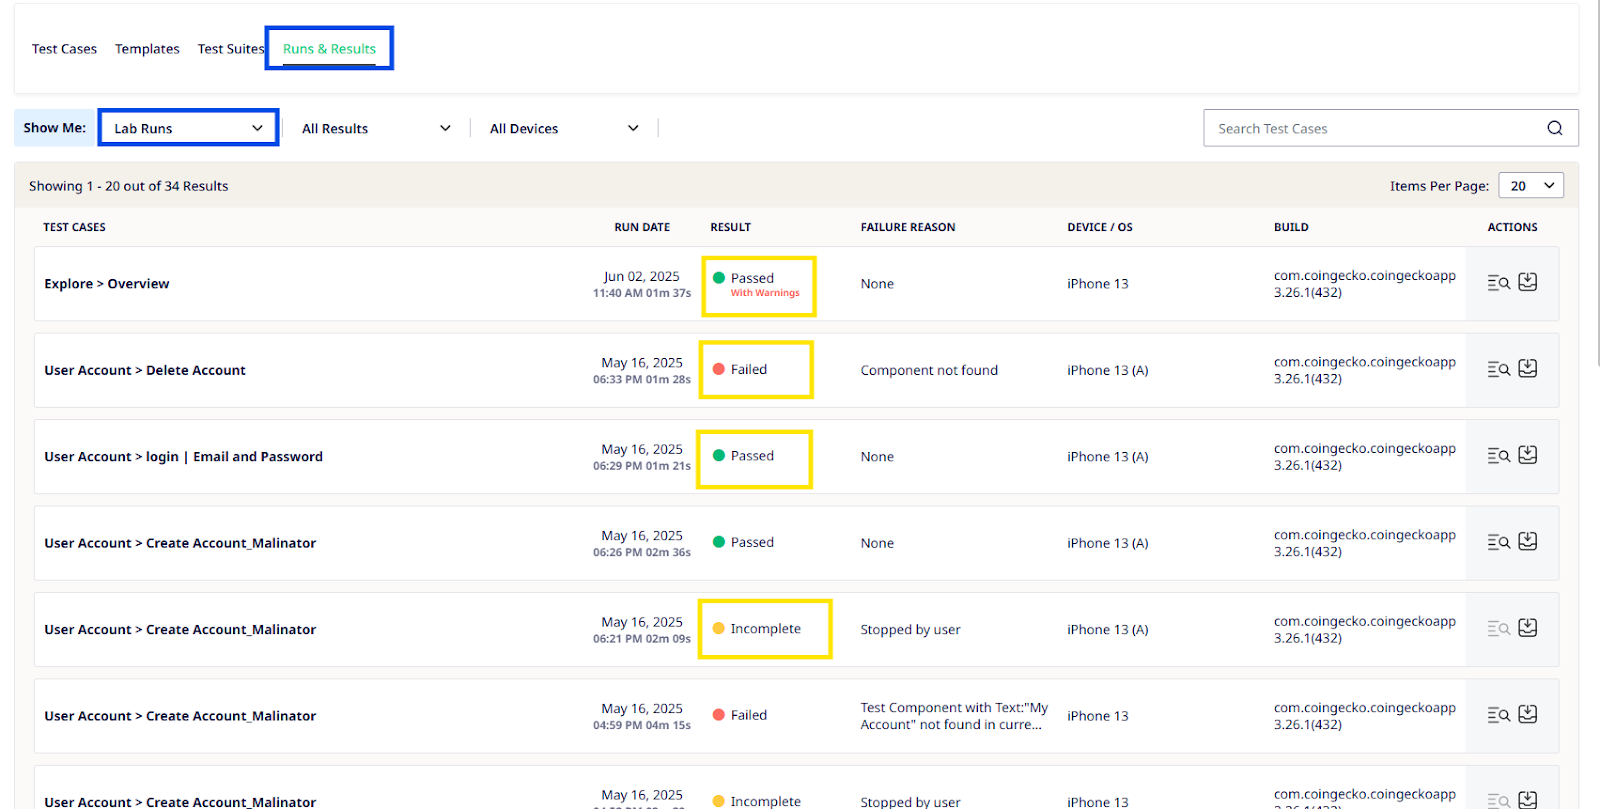
- Test Case Result Status (Passed, Failed, Passed with Warning, Incomplete)
- Failure Reason
- Device Info used in the run
- Run Date with timestamps
When you visit the Lab Run Result Listing, you will see the following test case statuses:
- Passed – The test case executed successfully without any issues.
- Failed – One or more steps in the test case did not complete as expected.
- Passed with Warning – Test case passed but encountered soft assertion failures.
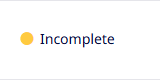
- Incomplete – The test execution was interrupted or stopped before completion.
These statuses help you quickly identify which test cases need further analysis or debugging.
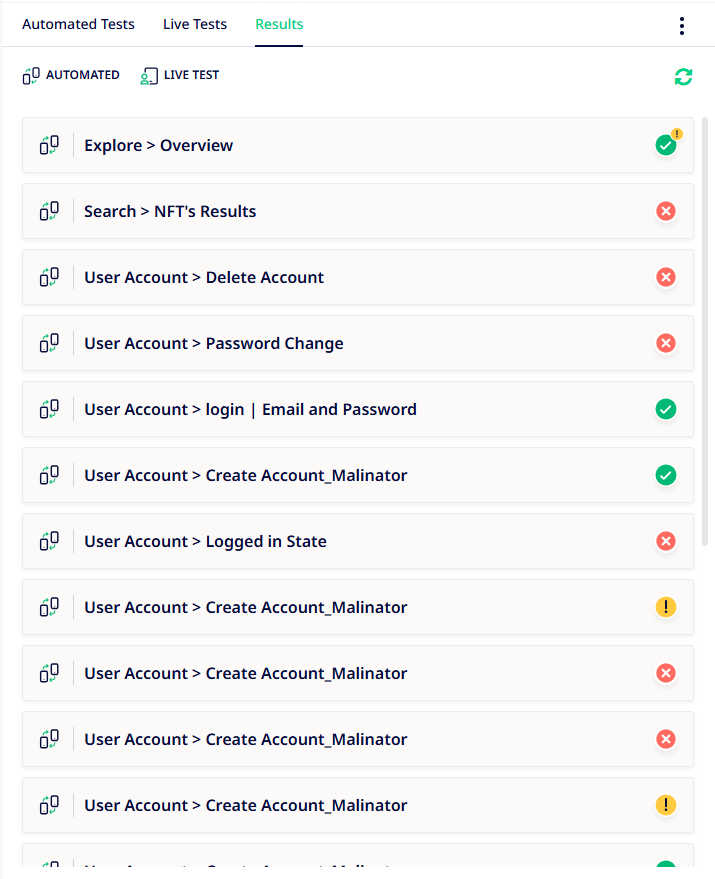
While in the case of Lab Results, when accessed directly via the Lab Session > Result tab, you will see:
Understanding Schedule Run Results:
The Scheduled Run Result view presents test execution summaries for each schedule. Here's how to read it:
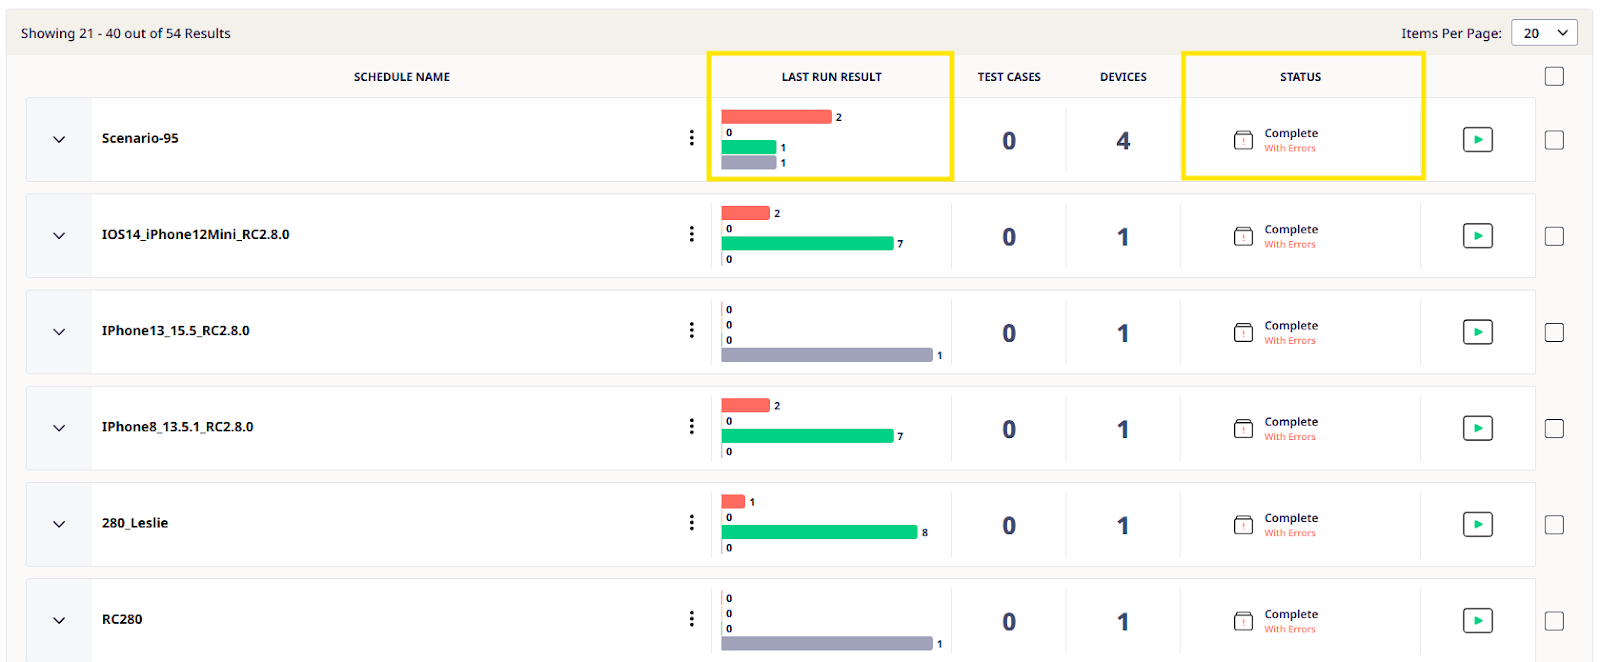
How to Use This View for Analysis
- Quickly identify failed or unstable schedules using the progress bar color indicators.
- Use the status and Last Run Result to filter schedules that need further investigation.
Metrics | What It Shows |
Schedule Name | The unique name or identifier of the scheduled run. |
Last Run Result | Visual bar with test results per status:Red: Failed, Green: Passed, Yellow: Passed with Warning, Grey: Skipped. |
Test Cases | Number of test cases in the schedule. |
Devices | Devices the run was executed on. |
Status | Final run status:Complete – Run finished successfullyComplete with Errors – At least one test failedCancelled by User – Run was stopped manually |
👉 This is your first step in result evaluation — understanding what failed and why.
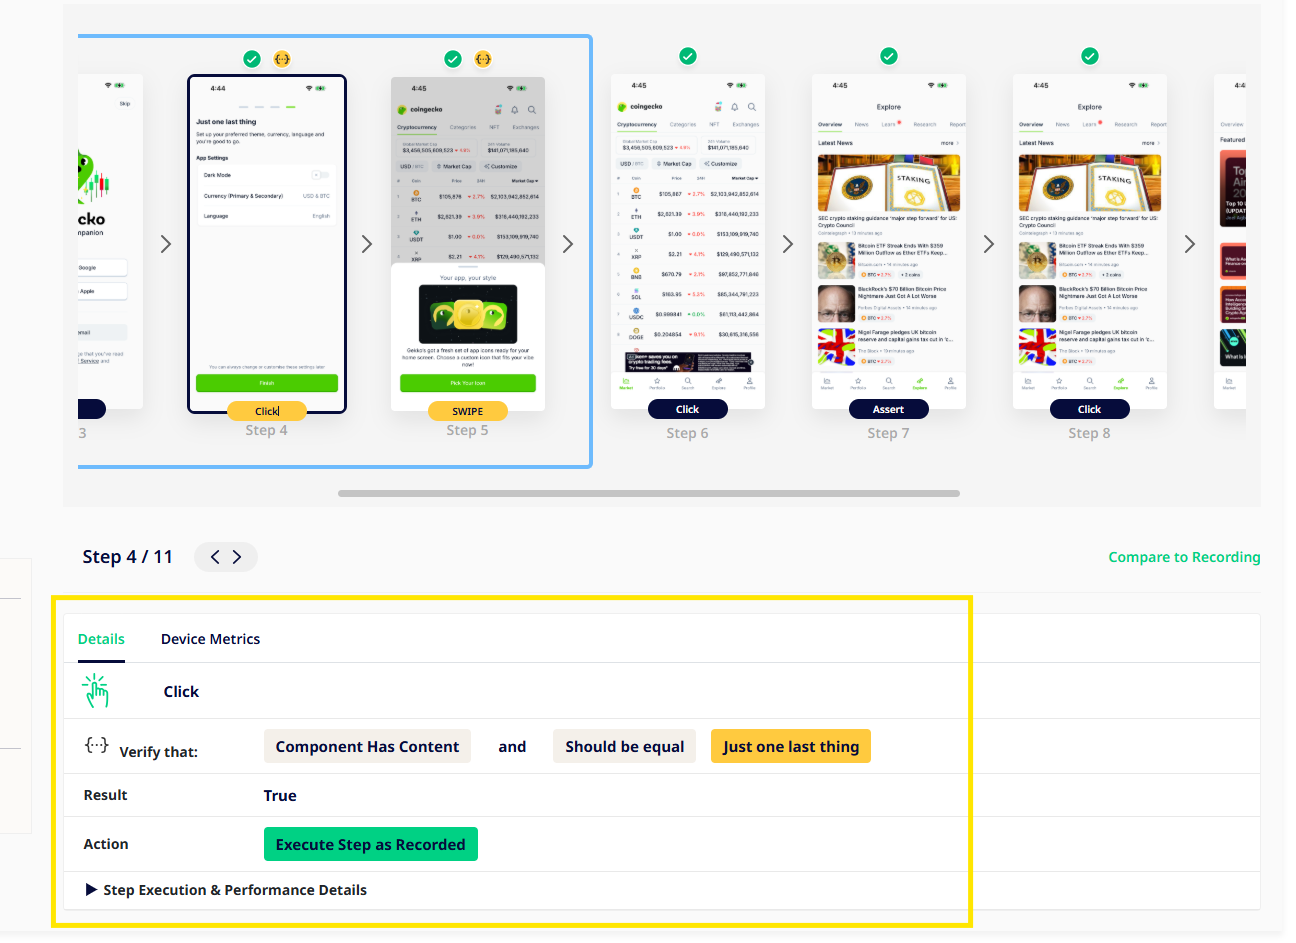
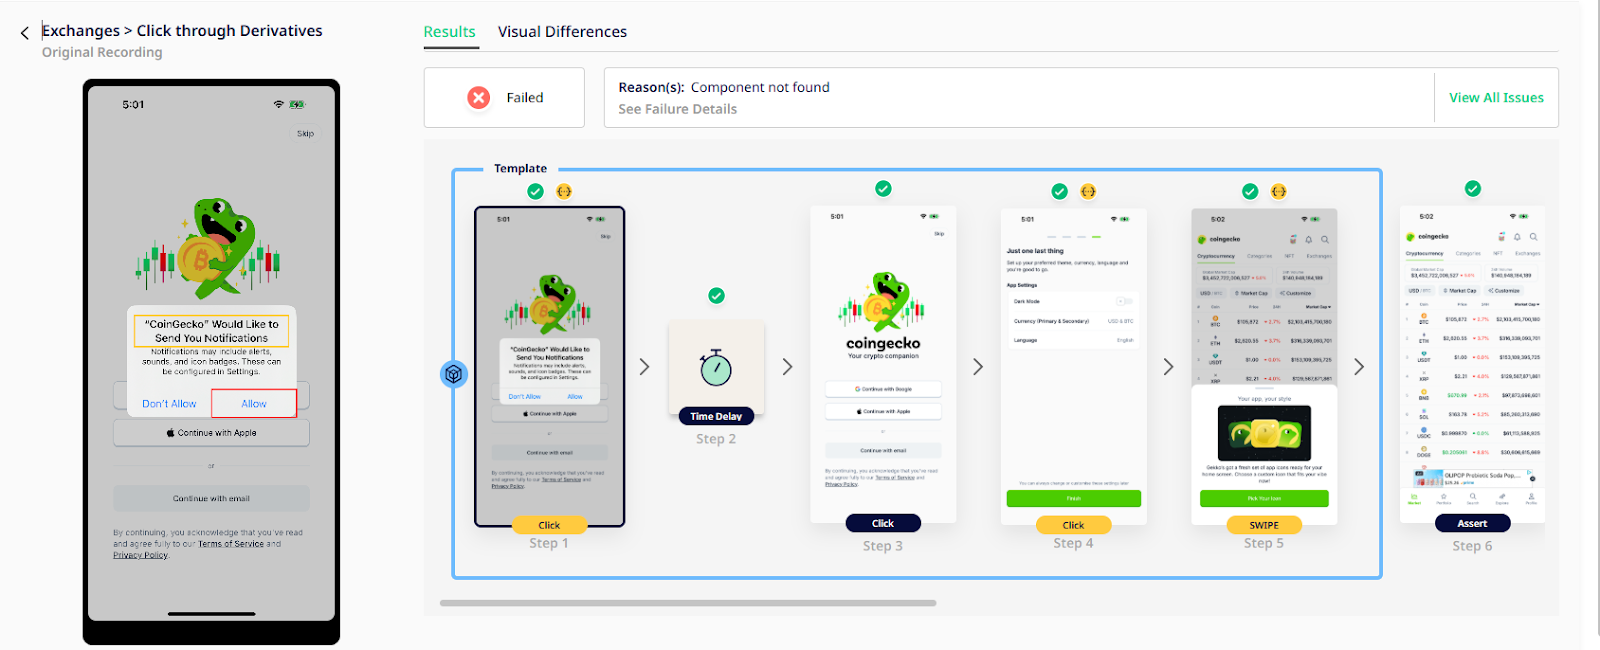
Detailed Result Analysis
After clicking on the “Details” button from the Lab Result or Scheduled Run view, a detailed result window opens. This window gives you an in-depth visual breakdown of the test execution.

Here’s what you’ll see:
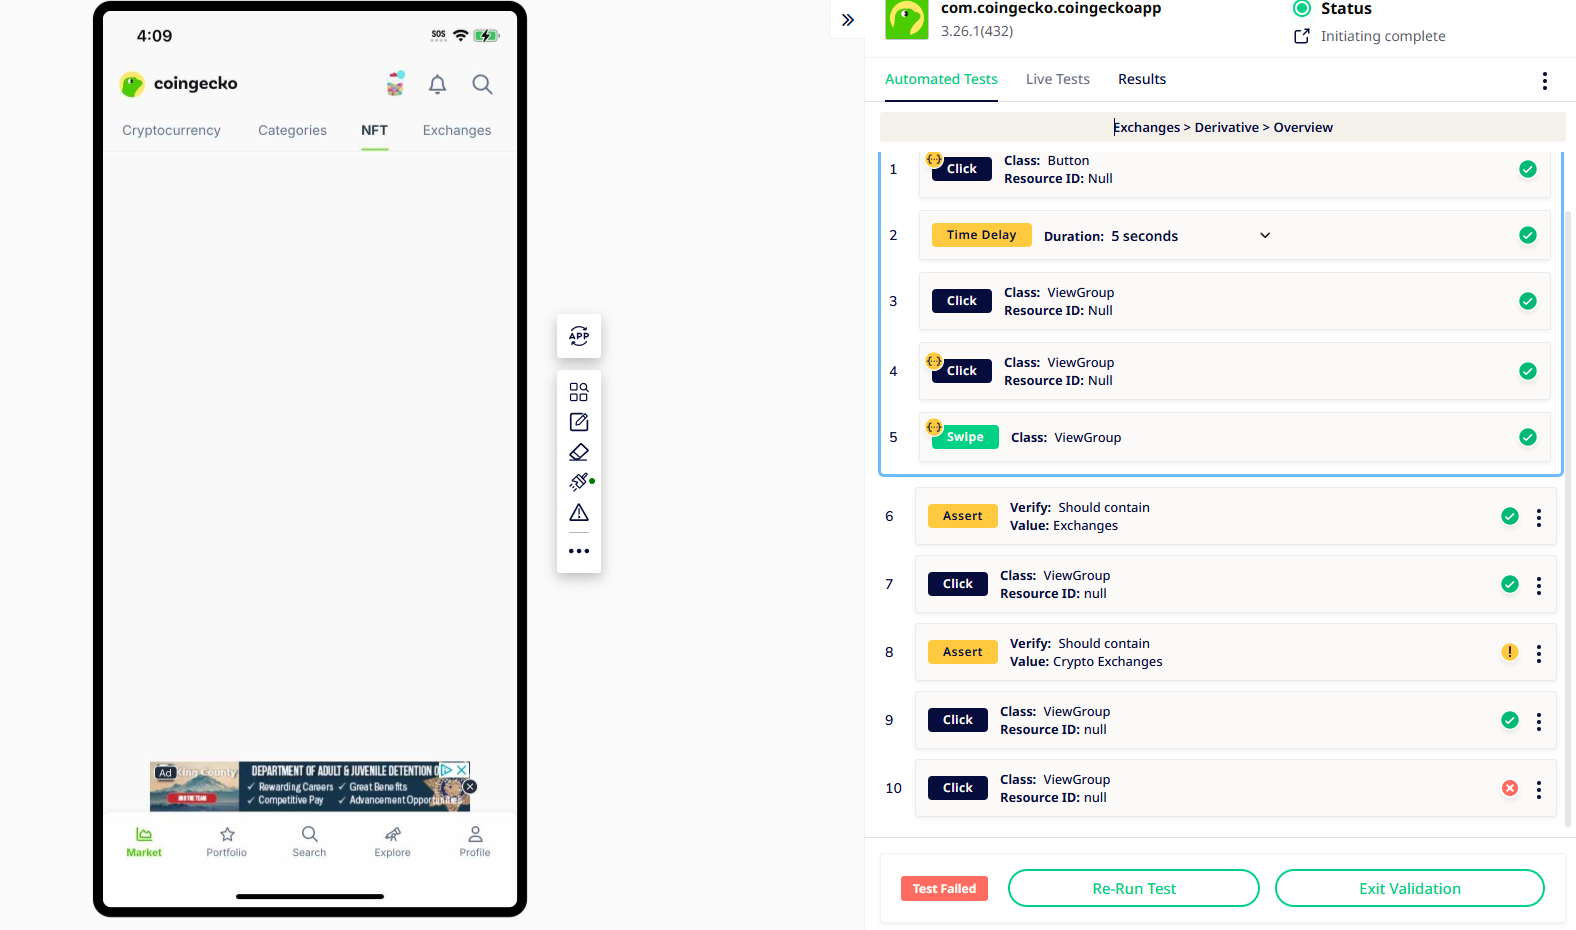
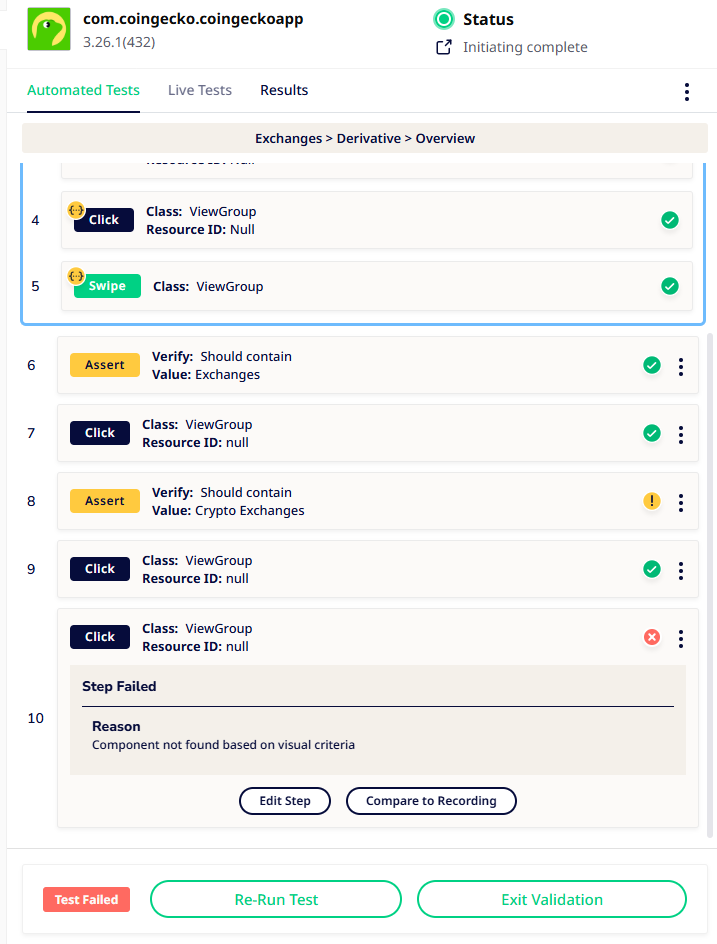
- Step-by-Step Visual View: Visual flow of each recorded screen (Steps 1–6 here), including user actions like Click, Swipe, or Time Delay.
- Step Preview Panel: Shows thumbnails for each step taken, including UI prompts and user interaction.
- Checkmarks: checkmarks confirm all steps visually matched the baseline or not.
- Step Details Actions: like tap, swipe, assert, and delay are labeled for each screen to indicate what the user performed.
- Action Markers: Click, swipe, or delay markers help QA confirm intended flows were correctly followed.
- Status Tags per Step:
- Passed
- Had warnings
- Failed
- Skipped
- Swimlane Format: Steps are displayed like a flow (swimlane), making it easier to track the execution path and spot where issues occurred.
- This view helps your analysis by giving you insights into:
- The exact step that failed or was skipped
- Reasons behind a "Passed with Warning" status
- Which UI element was missing or not found
- For Assert, Conditional, or Compare to Variable steps, you will see extra validation details under the "Details" tab – as highlighted in the screenshot.
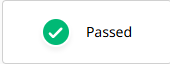
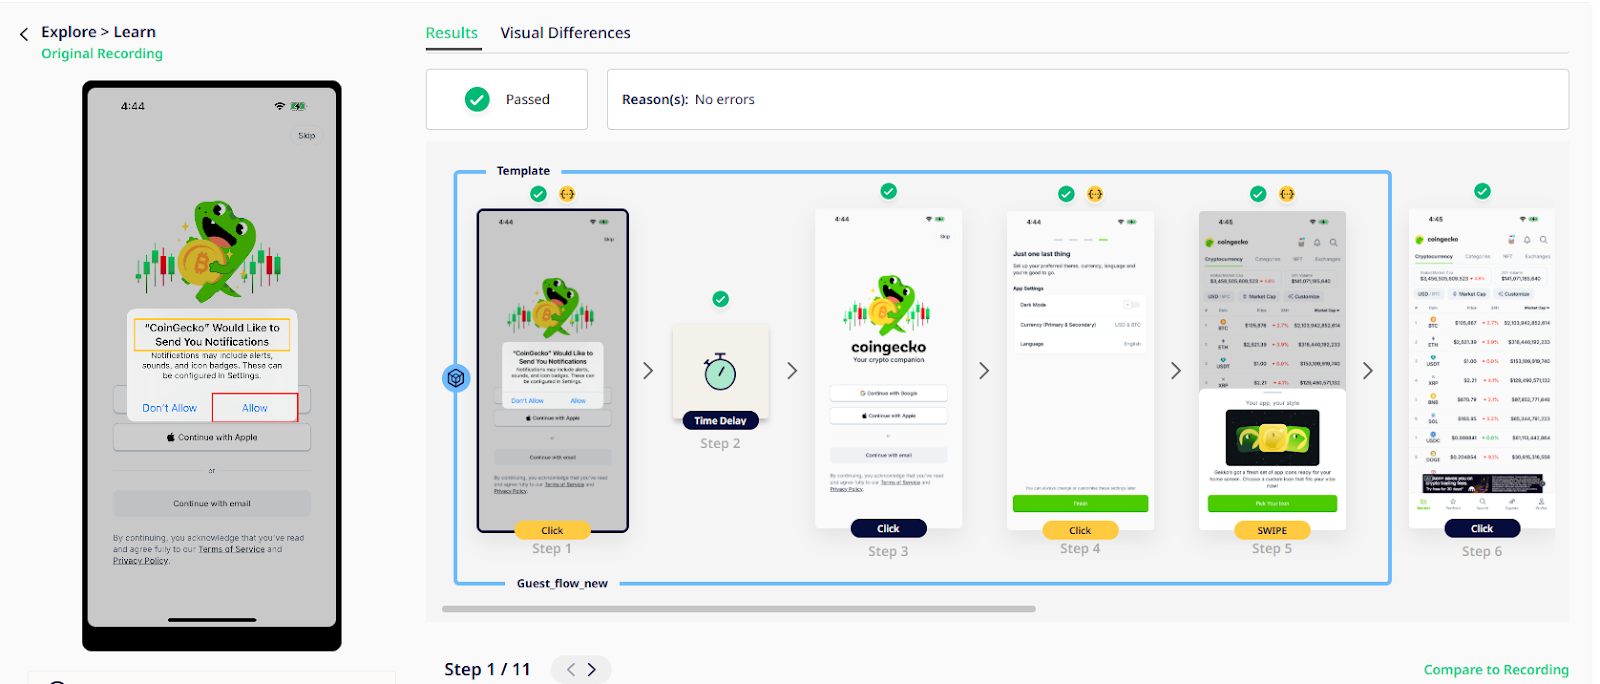
Scenario 1: Passed — All Steps Successful
When the test case passes, the following indicators confirm its success:
- Green checkmark appears above every step card.
- Result status at the top says: Passed
- Reason(s) section shows: No errors
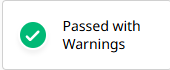
Scenario 2: Passed with Warnings
This result means all functional steps were successful, but one or more steps showed minor mismatch.
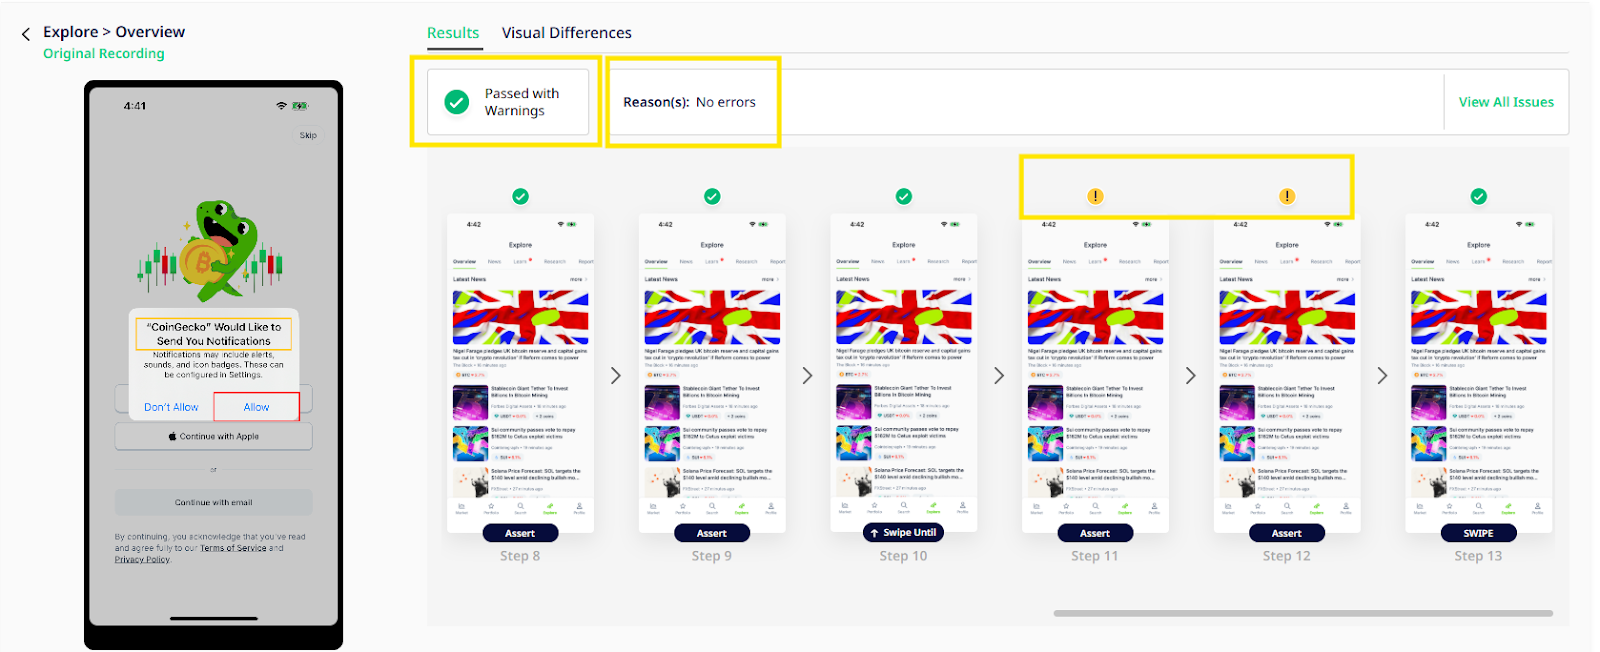
Steps show a mix of:
- Green checkmarks (✅) — Passed without issues.
- Yellow warning icons (⚠️) — Steps with differences.
Result status at the top says: Passed with Warnings.
Reason(s) section shows: No errors (i.e., logic and flow were valid).
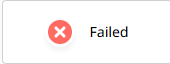
Scenario 3: Failed
- Red checkmark appears above the failed step card.
- Result status at the top says: Failed
- Reason(s) section shows: Reason of failure
Deep Dive: Investigating Warning/Failed Steps
When a step is flagged with a warning or failure, follow these actions to identify and validate the issue:
Step-by-Step Investigation
- Identify the Step:
- Go to the Details Tab: Observer the Details
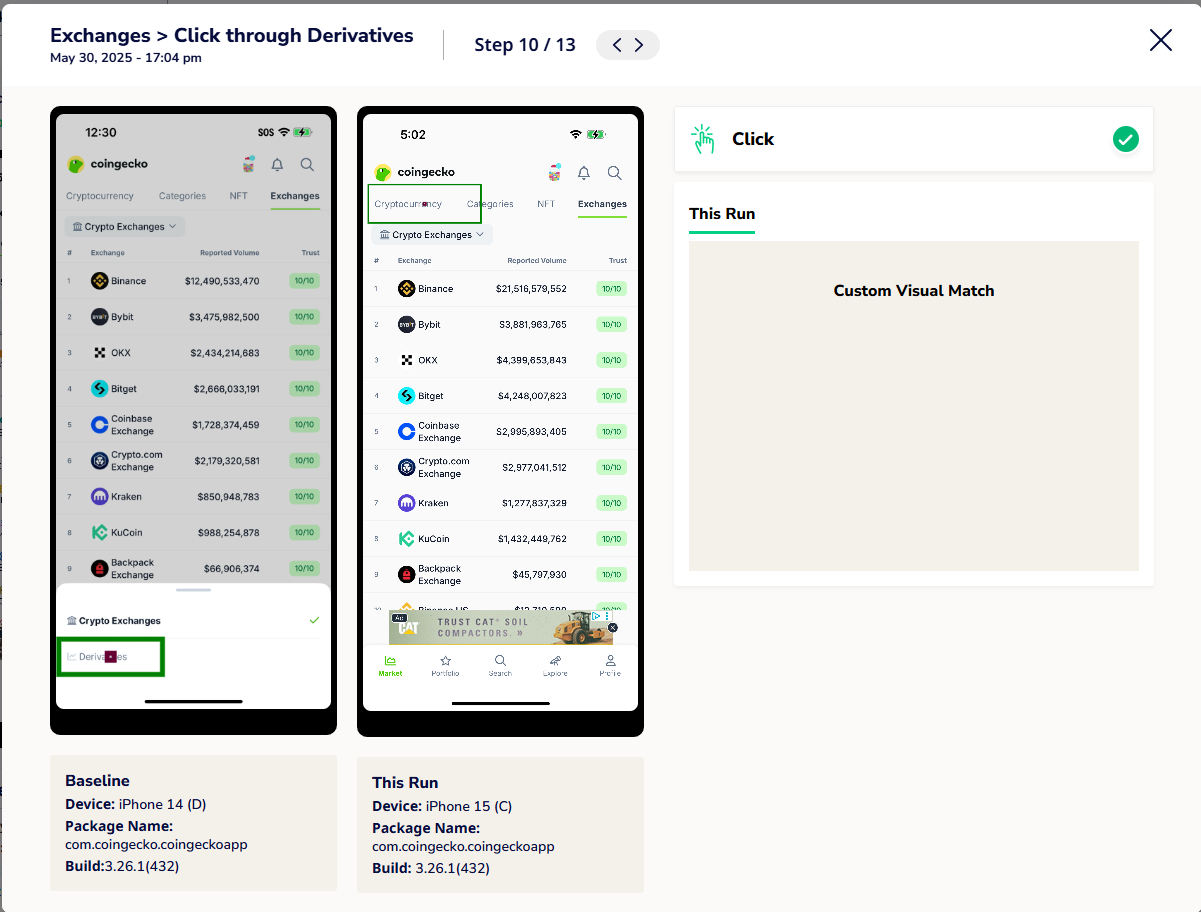
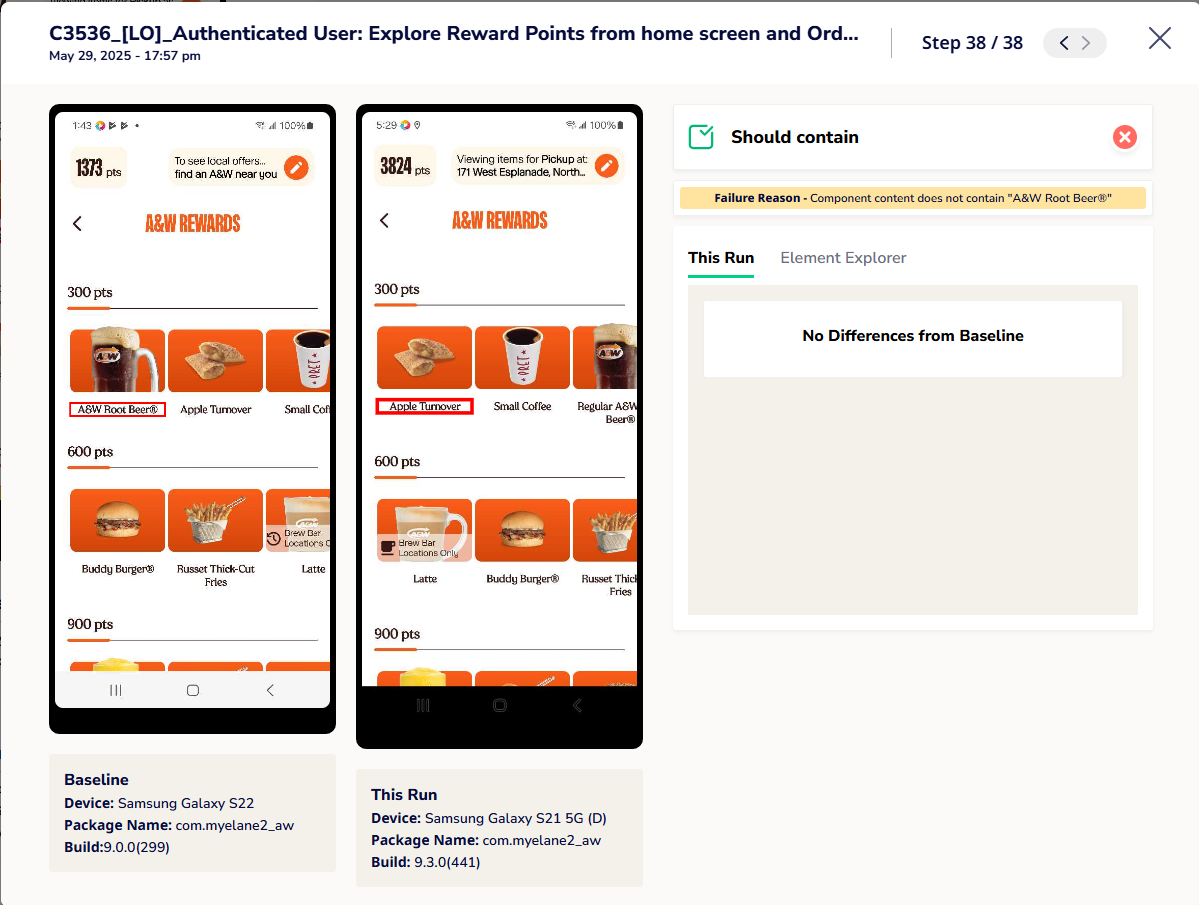
- Click Compare to Recording and Analyze the Difference:
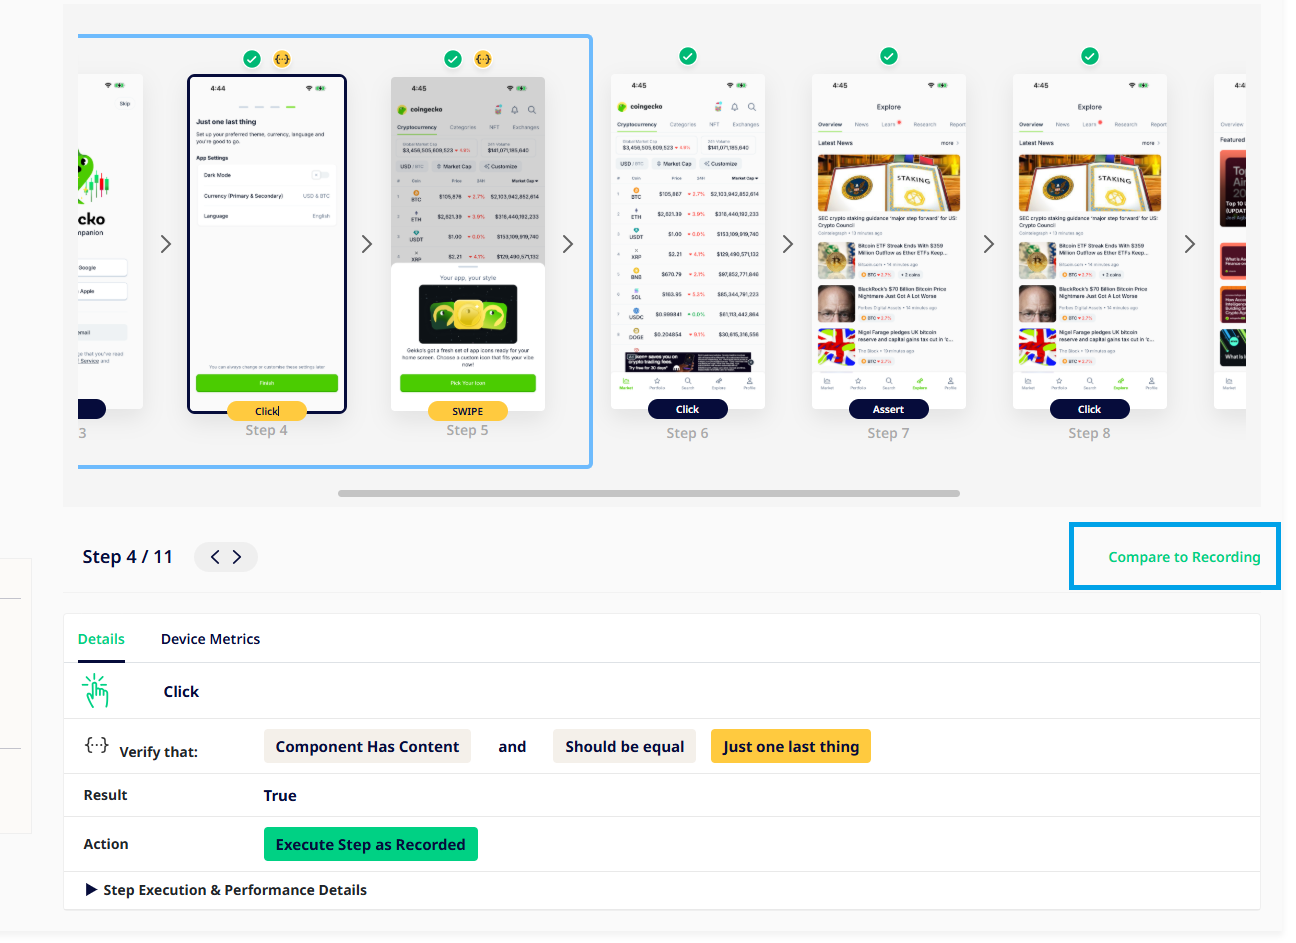
- Open a side-by-side view of baseline vs. current run to visually inspect UI changes.
- Check if the element existed, locator was accurate, and whether values are dynamic or hardcoded.
- For swipe failures, validate direction, screen state, and retry logic.
- Look for element position shifts, delayed loads, or layout changes causing step skips.
- Review previous steps for silent failures and confirm if the action occurred on the correct element.
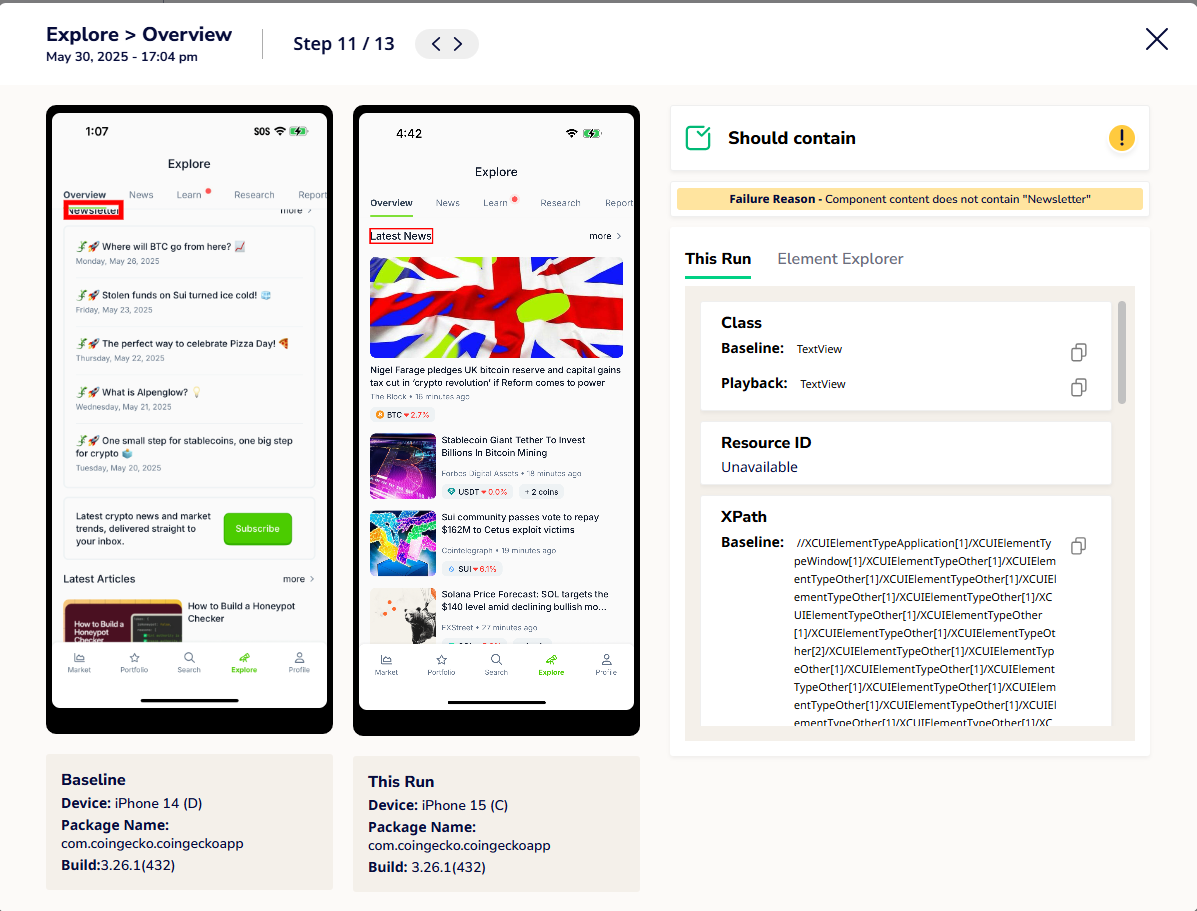
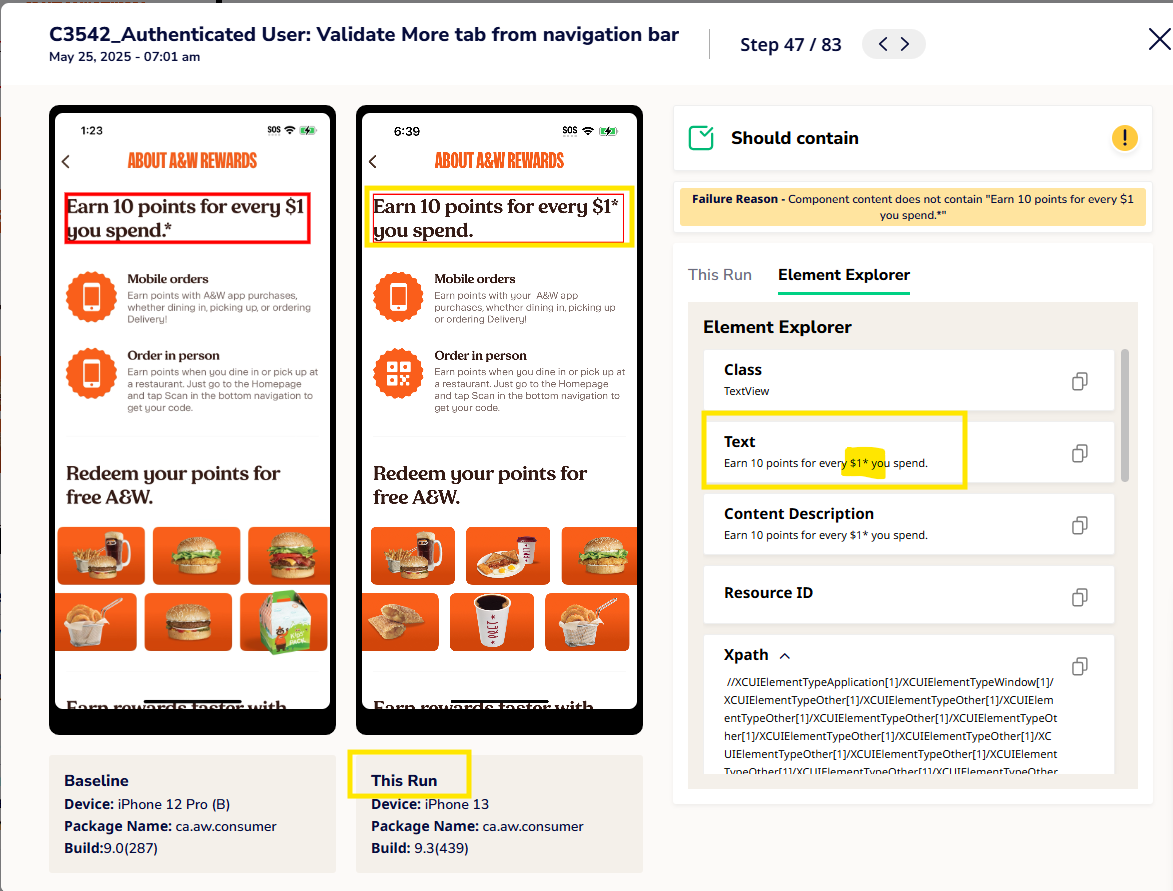
Use Element Explorer:
Navigate to the exact element in both baseline and current run.
Click the element on both screens to compare metadata like:
- Class , Resource ID
- Element labels/text, content description
- Parent structure or hierarchy [Xpath]
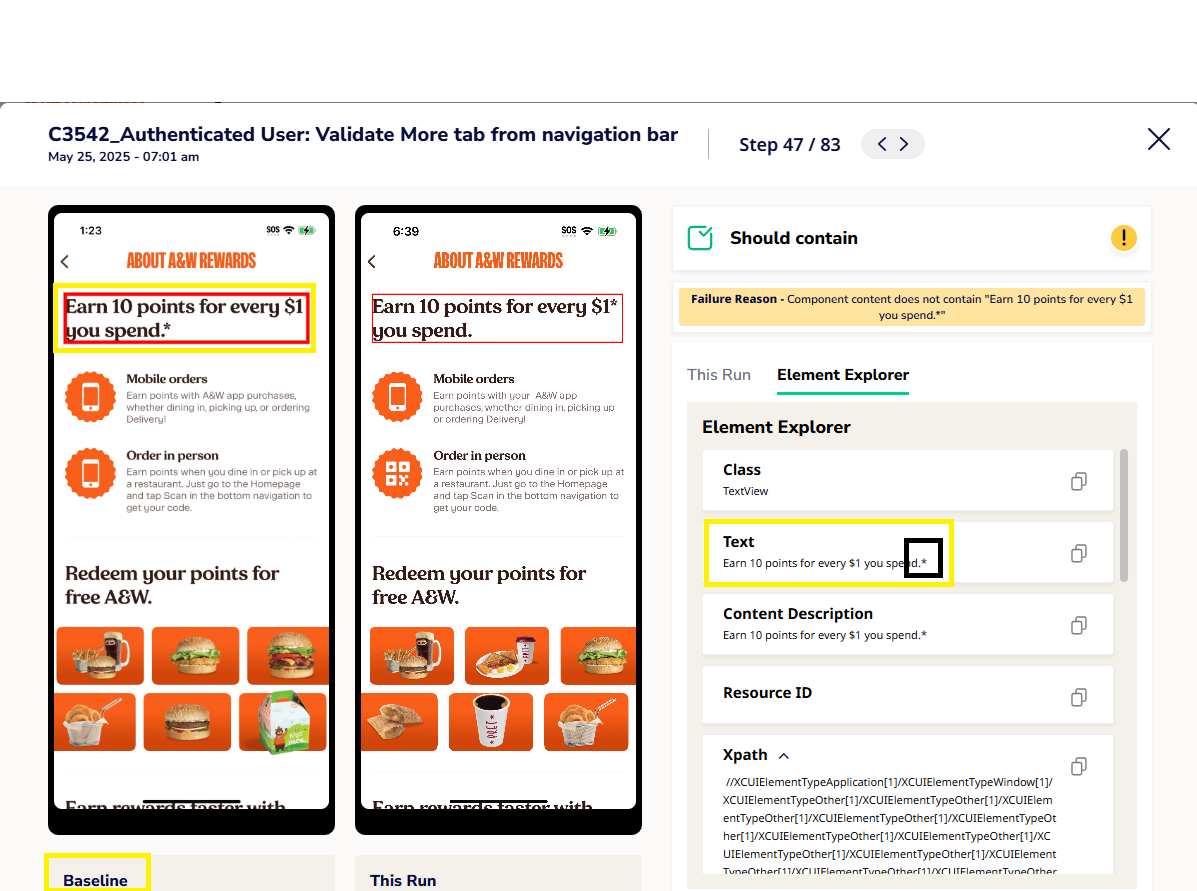
Example: In this case, the step failed because the text component and content description of the element changed.
Validate What Changed
Examples of common failure scenarios:
The click action was triggered at a different position than expected. This could be due to UI shift or change in element placement, resulting in interaction with an unintended element.
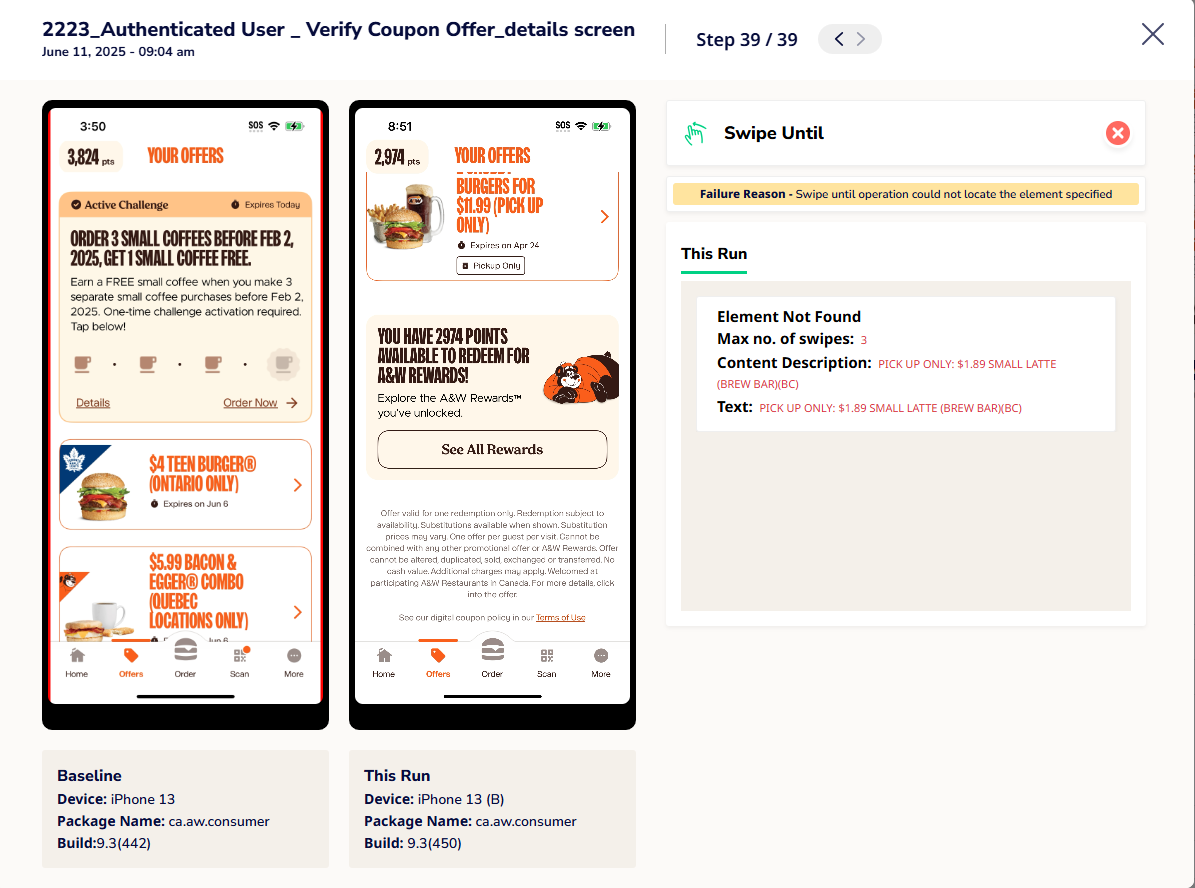
Issue: The swipe action couldn't find the target element it was supposed to locate.
Root Cause: The element that the script was looking for has been removed or changed in the app.
Solution:
Find a stable element - Look for an element that is always present on the screen
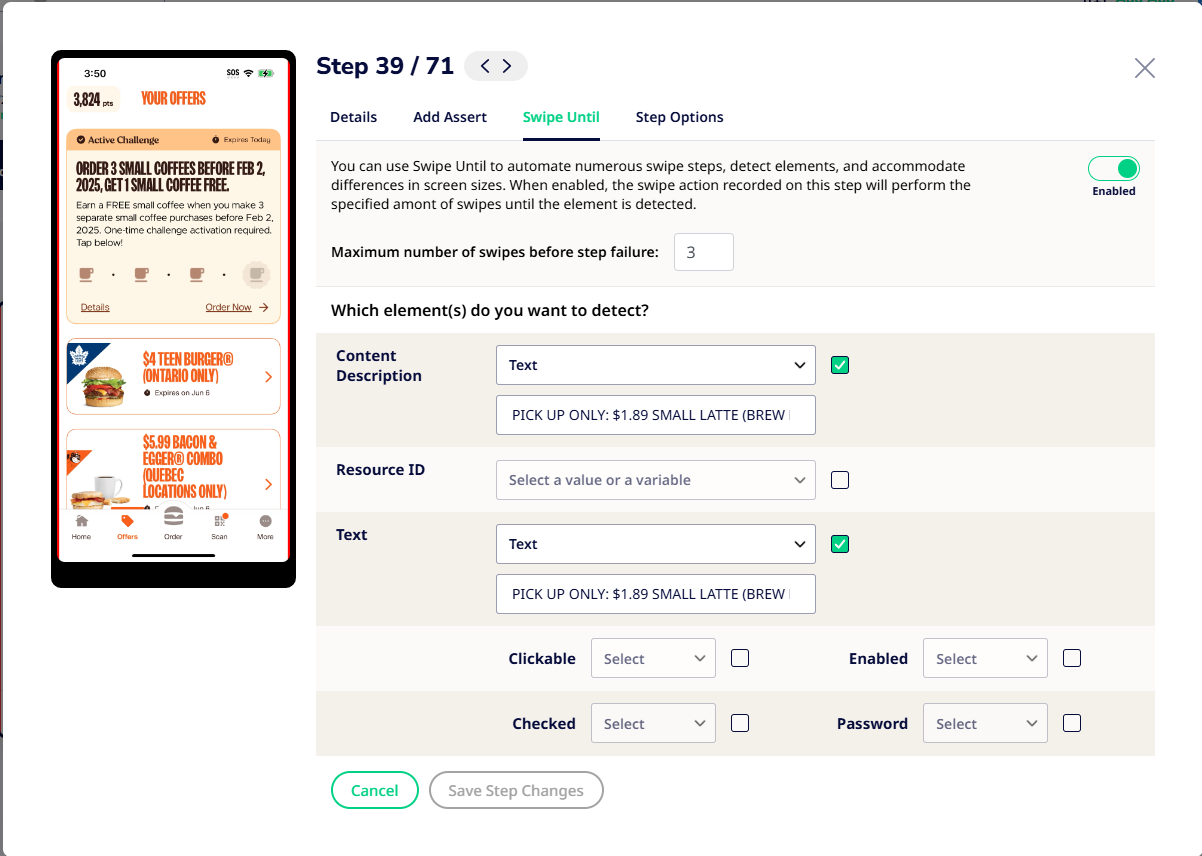
Update the Swipe Until parameters - Change Content Description, Text, Resource ID to target reliable element instead
Check this guide for more information on how to edit swipe until steps.
The placement of the target element changed, or the item list was updated. As a result, the click was executed on the wrong element due to incorrect UI mapping or index shift.
Tool Overview: Element Explorer
Element Explorer is a powerful visual debug tool, allowing you to:
- Inspect element attributes (ID, label, type)
- Debug failed steps by checking which element failed to load or interact
- Identify issues like incorrect selectors, dynamic changes, or app crashes, step skipped, etc
Scenario 4: Incomplete, Not Executed
For test cases marked as Incomplete or Not Executed, the Details window is not available for both Lab Run and Scheduled Run Results.
These test runs must be evaluated directly through the status tag and failure reason shown in the test run result list view.
- Incomplete: The failure reason is visible beside the result tag, helping you understand what interrupted the execution.
- Not Executed: The test never started. The cause is shown under the failure reason column in the result listing.
These two pieces of information are the only way to judge and debug such cases, and are generally sufficient for initial analysis.
Understanding Draft state TC Lab Run Results:
When reviewing Draft test cases in Lab runs, these are test cases executed manually and saved as part of exploratory sessions.
- If a test case fails, steps will be marked with ❌ red cross indicators.
- You can click on any failed step to view more details in the step panel.
- Use the “Compare to Recording” feature to analyze what deviated from expected behavior.
- The Element Explorer tool can help you inspect the specific UI element involved, identify mismatches in selectors, missing components, or delays in appearance.
Draft state debugging is useful during early-stage test creation or ad hoc testing when the goal is to iterate quickly and refine test steps based on observed behavior.